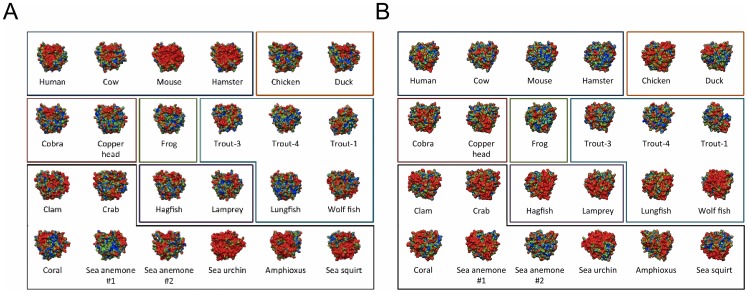
Figure 5. Mutation-based perturbation maps for 24 C3d homologues.
The cumulative electrostatic similarity distributions for alanine-scan charge perturbations are projected onto the surface of each respective structure with two rotations: (A) CR2-face and (B) thioester-face. Perturbation map color scheme is: blue – green – red; low to high similarity, corresponding to ESI values of 0.5–0.7–0.9. Colored boxes are used to group homologues from similar species. The box color code is as follows: mammals, dark-blue; birds, orange; reptiles, red; amphibians, green; fish, light-blue; jawless fish, purple; invertebrates, black.

