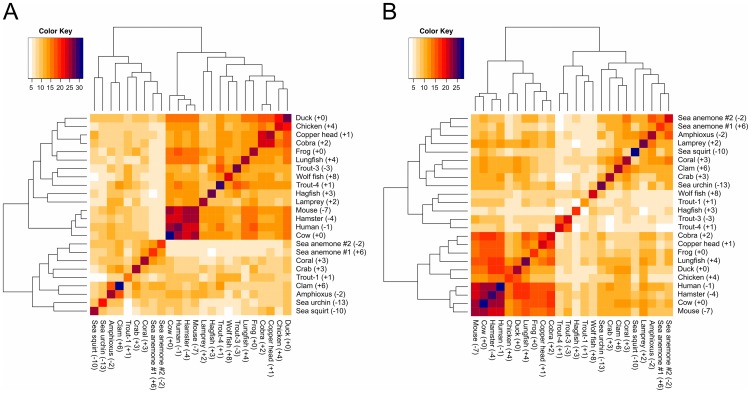
Figure 6. Charge similarity clustering for the two sides of C3d.
Dendrograms with distance matrix heatmaps illustrate clustering of the 24 C3d homologues based on the number of positions with the same charge within the two functional regions: (A) CR2-face and (B) thioester-face. Net charge of each homologue is provided in parentheses.

