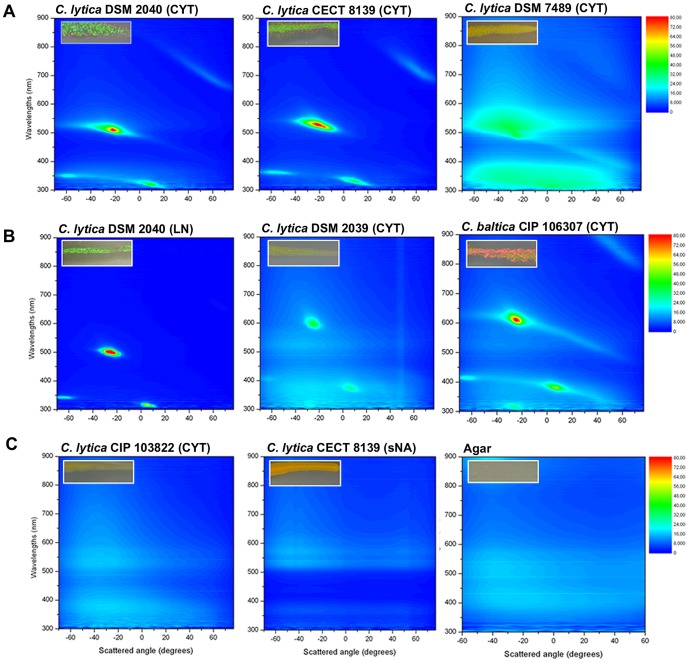
Figure 2. Spectral properties of the different glitter-like iridescence profiles.
The color maps show the angle-dependent spectral reflectance of Cellulophaga spp. colonies grown 24 h on different media. Samples were illuminated at a fixed light angle of −70°. Scattered wavelengths from 300 nm to 850 nm were recorded at different detection angles from −65° to 70° with 5° angle step resolution. Results are shown using a color intensity scale. As shown in the small inserts (upper left in each color map), iridescence profiles correspond to: (A) green and red iridescence profile with high intensity from C. lytica DSM 2040, moderate intensity from C. lytica CECT 8139, and low intensity from C. lytica DSM 7489; (B) other color profiles with green profile from C. lytica DSM 2040 on LN, yellow profile from C. lytica DSM 2039 and red iridescence profile from C. baltica CIP 106307; (C) non-iridescent controls with C. lytica CIP 103822, C. lytica CECT 8139 on sNA and the CYT agar control. Wavelength values: UV, <400 nm; violet, 400 to 435 nm; blue, 435 to 490 nm; cyan, 490 to 520 nm; green, 520 to 560 nm; yellow, 560 to 590 nm; orange, 590 to 620 nm; red, 620 to 700 nm; and infrared, >700 nm.

