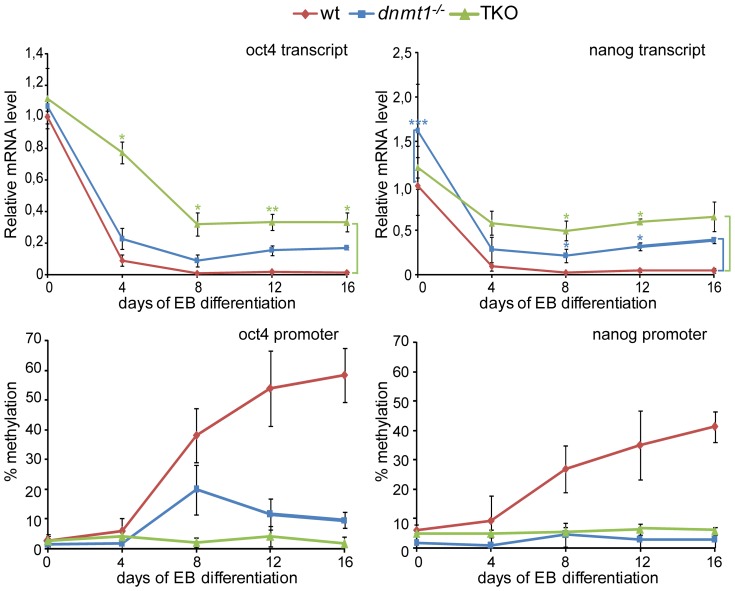
Figure 1. Partial silencing of oct4 and nanog in Dnmt1−/− and TKO EBs.
Oct4 and Nanog transcript levels (upper panels) and respective promoter methylation (lower panels) during differentiation of wt, Dnmt1−/− and TKO ESCs as EBs. Transcript levels were measured by RT-qPCR and are shown relative to wt ESCs (day 0). DNA methylation levels were determined by bisulfite conversion followed by PCR and pyrosequencing. Five and 4 CpG sites in the proximal promoter regions of oct4 and nanog, respectively, were analyzed and respective values were averaged. Mean values and standard errors of 2 and 3 biological replicates are shown for DNA methylation and expression analyses, respectively. Asterisks indicate significance levels: * p<0.05; ** p<0.001; *** p<0.0001 (Student t-test).

