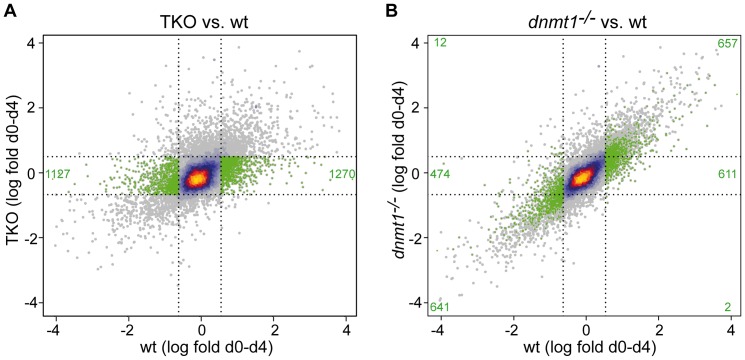
Figure 4. Genome-wide expression changes in early wt, Dnmt1−/− and TKO EBs.
Scatter plots of genome-wide expression changes between day 0 and 4 in TKO (A) and Dnmt1−/− EBs (B) relative to wt EBs. Data points are heat-colored according to their local density. About 17% of 25528 analyzed genes changed expression level in wt EBs according to the thresholds indicated by the vertical dotted lines. Genes whose expression levels increased and decreased in wt but not in TKO EBs (“TKO non-responders”, parts of the corridor between the horizontal dotted lines to the left and right of the vertical dotted lines in A) are marked in green in both A and B and their numbers are reported in green in the respective sectors.

