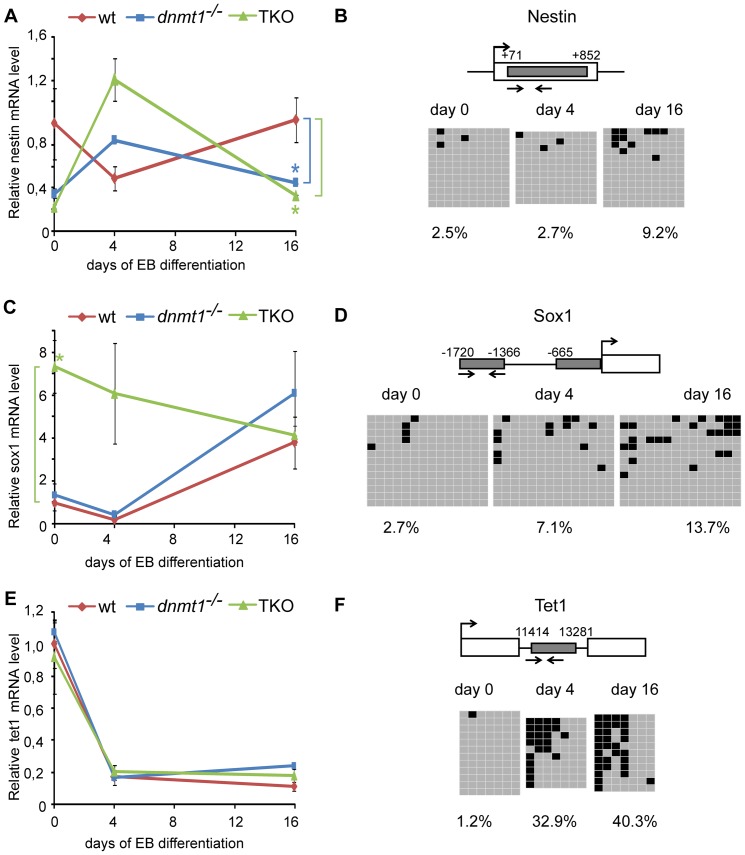
Figure 5. CpG island methylation and disregulated expression of selected bivalent genes in wt and mutant EBs.
Transcript levels and CpG island methylation of bivalent genes Nestin (A,B) and Sox1 (C,D) as well as the non-bivalent gene Tet1 (E,F) in undifferentiated ESCs (day 0) and at day 4 and 16 of EB culture. (A,C,E) Transcript levels were measured by RT-qPCR in wt, Dnmt1−/− and TKO ESCs/EBs as indicated. Mean values and standard errors from three independent biological replicates are shown. All values are normalized to undifferentiated wt ESCs. Asterisks indicates the significance level p<0.05 (Student t-test). (B,D,F) DNA methylation analysis by bisulfite sequencing in wt ESCs/EBs. In the gene cartoons large arrows indicate transcriptional start sites (TSS), open rectangles represent exons, grey shaded rectangles represent CpG islands and numbers indicate the positions of their borders with respect to the TSS. Small arrows indicate the analyzed regions. In the panels grey and black squares indicate unmethylated and methylated CpG sites, respectively. Percentages of total CpG methylation within the analyzed regions/clones are reported at the bottom of each panel.

