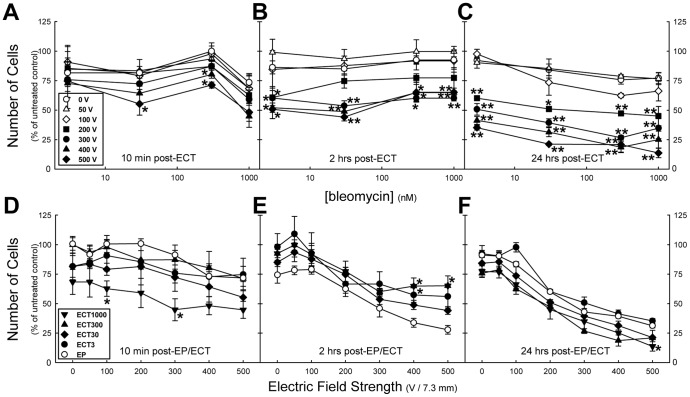
Figure 7. The number of cells in electroporation- or electrochemotherapy-treated HMEC-1 monolayers.
The number of cells in the monolayers at 10 min (A, D), 2 hrs (B, E), and 24 hrs (C, F) post-exposure. Each data point represent the mean ± SE from n = 3 independent experiments, except for post-ECT1000 10 min n = 5, 24 hrs n = 6. * P<0.05, ** P<0.001 compared to 0 V (A, B, C) or to EP data (D, E, F).

