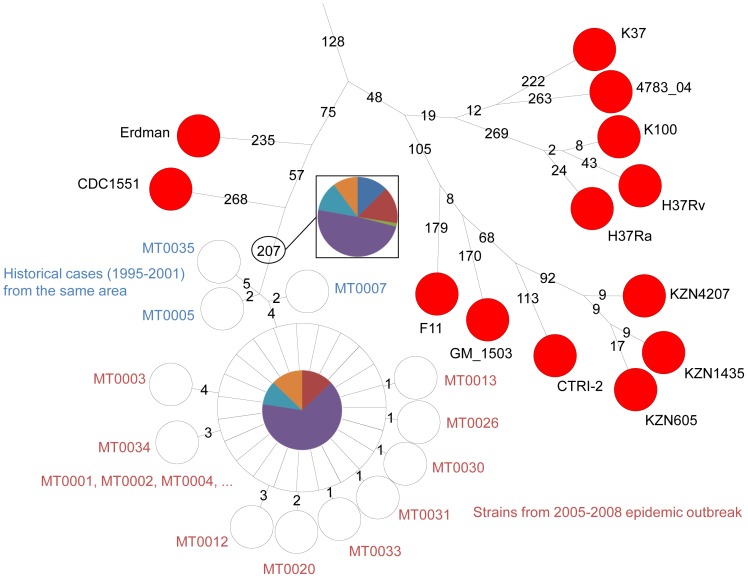
Figure 5. Genetic distances within an outbreak.
Investigation of 32 M. tuberculosis outbreak isolates sampled in 2005–2008 and 3 historical isolates sampled in 1995–2001 from the investigation by [52]. The sequence reads were analysed together with the other genomes using the same SNP selection rules. The three historical samples collected a few years earlier in the same region are numbered in blue. Twenty-two outbreak samples corresponding to the central node show an identical genotype. Nine samples numbered in red are one to four SNPs away from the central node in a star like pattern. MT0001 the most likely index case belongs to the central node. Each branch length (number of SNPs) is indicated in black, logarithmic scaling is used. The proportion of the different mutations detected among historical and outbreak isolates is shown using the same color code as in Figure 7.

