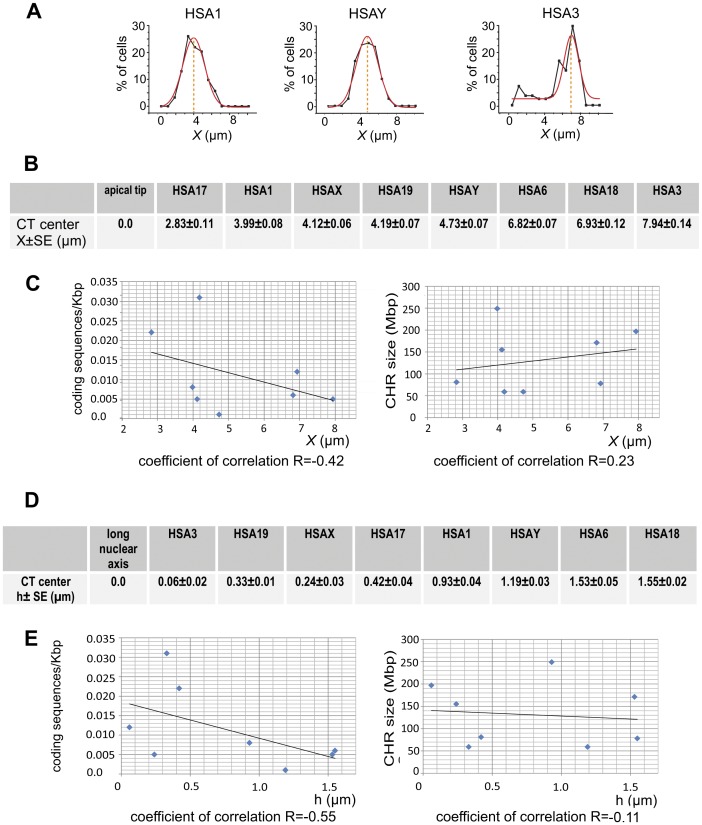
Figure 2. Relation between chromosome properties and their intranuclear localization in spermatozoa.
(A) Examples of the CHR longitudinal coordinate determination using the Gaussian approximation (red line) of the frequency distribution data (black line). Numerical values of longitudinal (B) and lateral (D) coordinates of the CT centers. Correlations between the longitudinal (C) or the lateral (E) chromosome positioning and densities of coding sequences (left panels) or the chromosome size (right panels). x – the distance from the apical end of the sperm nuclei, h – the distance between the CT center and the long nuclear axis as described in the scheme Fig. 1,B.

