
Figure 2. Dose-response of SCFA on AP-1 pathway activation.
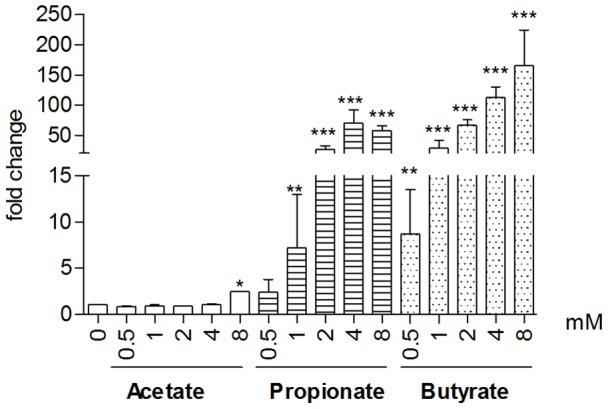
HT-29/AP-1 cells were exposed to increasing concentrations for 24 h. Data are mean ± standard error of the mean (SEM) of triplicate measurement of one representative of three independent experiments; ***P<0.001, **P<0.005, *P<0.05 as compared to control.