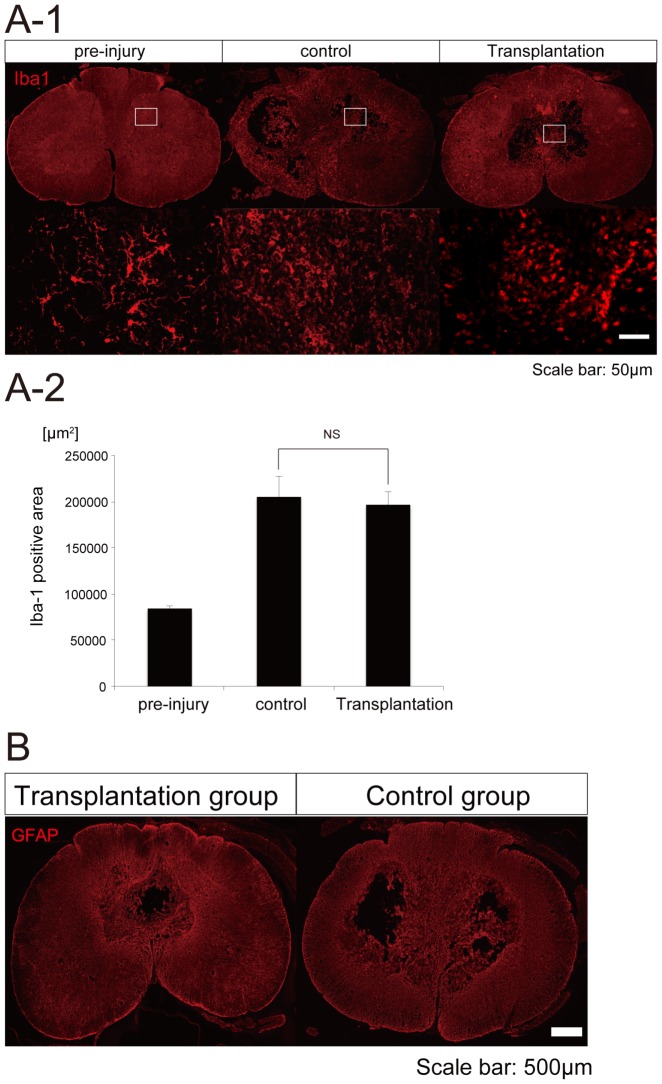
Figure 6. Microglial activation and glial scar formation at 12 weeks after transplantation.
(A-1) Representative images of Iba1 staining in the spinal cord at the lesion epicenter at 12 weeks post-engraftment. Iba1-positive microglia showed a more rounded shape in the control and transplantation groups than in the pre-injury sample. (A-2) Quantification of the size of the Iba-1-positive area. The size of the Iba-1-positive area was not significantly different between control and transplantation groups at 12 weeks post-transplantation. (B) Representative GFAP-stained images of axial sections at the lesion epicenter at 12 weeks after cell transplantation. There were no significant differences in the size of GFAP-positive areas between the hiPSC-NS/PCs and the control groups.

