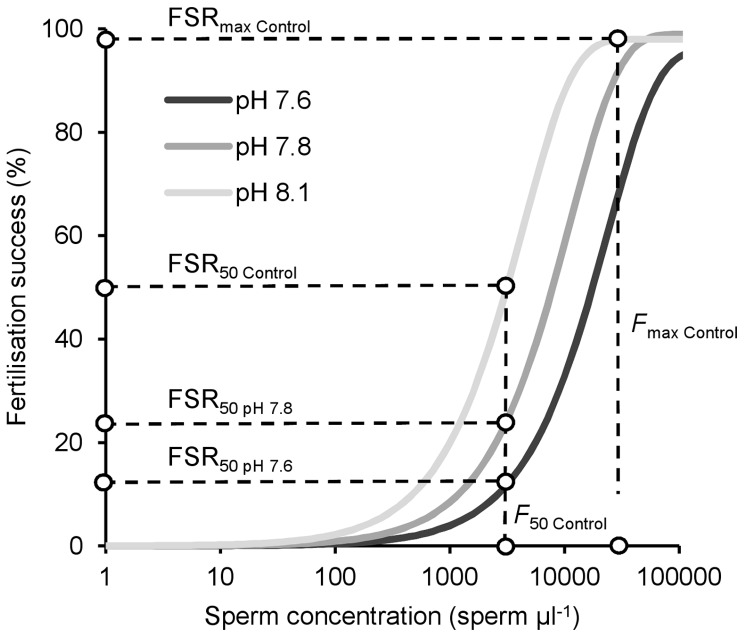
Figure 1. Schematic representation of the relationship between fertilization success and sperm concentration of Heliocidaris erythrogramma at different pH levels, assuming a negative pH impact on fertilization.
Determining fertilization success at an intermediate sperm concentration (here, the sperm concentration that generates 50% of maximum observed fertilization success in controls) yields maximum sensitivity in the assay. All data in Fig. 1Figure 1 are theoretical. FSRmax Control = maximum fertilization success in Controls; FSR50 Control = 50% of maximum fertilization success in Controls; F max Control = sperm concentration that generates maximum fertilization success in Controls; F 50 Control = sperm concentration that generates 50% of maximum fertilization success in Controls. FSR50 pH 7.8 = observed fertilization success in pH 7.8 treatment at the sperm concentration that generates 50% of maximum fertilization success in Controls; FSR50 pH 7.6 = observed fertilization success in pH 7.6 at the sperm concentration that generates 50% of maximum fertilization success in Controls. Actual fertilization curves vary for each individual pair.

