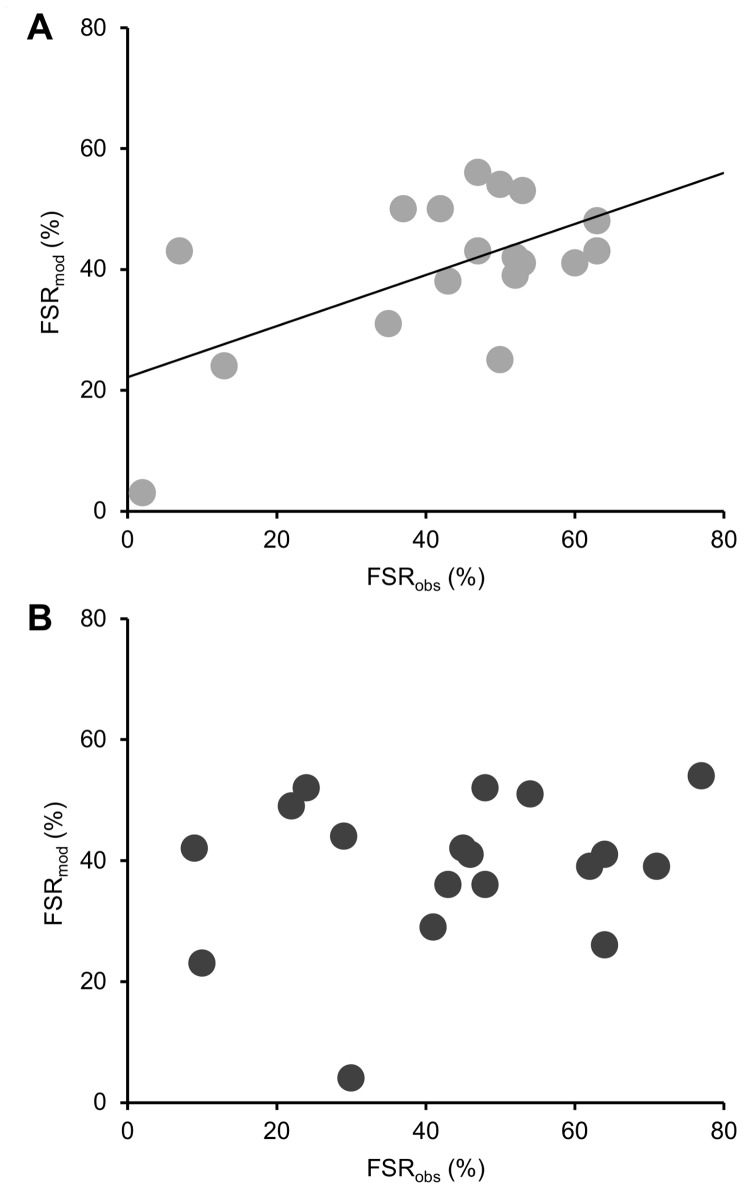
Figure 4. Scatterplots for observed (FSRobs) versus modelled (FSRmod) fertilization success for pH 7.8 (A) and 7.6 (B).
Regression analyses revealed a significant relationship between observed (independent) and modelled fertilization (dependent) for pH 7.8 (P = 0.012, r2 = 0.336), but not for pH 7.6 (P = 0.413, r2 = 0.042).

