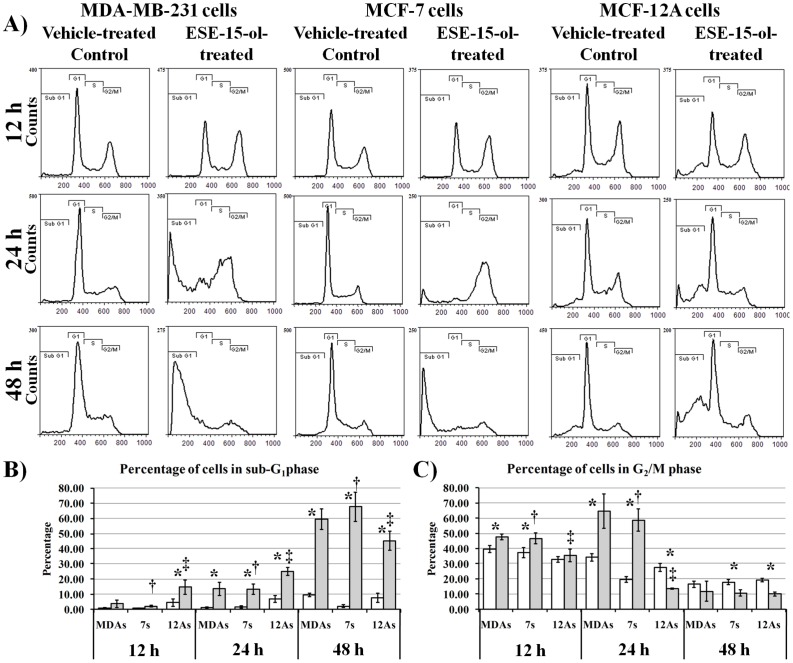
Figure 5. Effects of ESE-15-ol on cell division over time.
A) Cell cycle histograms of vehicle-treated and ESE-15-ol-treated MDA-MB-231, MCF-7 and MCF-12A cells after 12 h, 24 h and 48 h exposure. B) Time-dependent change of vehicle-treated and ESE-15-ol-treated MDA-MB-231, MCF-7 and MCF-12A cells in sub G1 B) Time-dependent change of vehicle-treated and ESE-15-ol-treated MDA-MB-231, MCF-7 and MCF-12A cells in mitosis (G2/M). A gradual increase in the sub-G1 fraction is observed over time in ESE-15-ol-treatment across all cell lines, indicating increased cell death. After 48 h, the MCF-12A cells were less affected when compared to the MDA-MB-231 and MCF-7 cells. * indicates a t-test P-value <0.05 for difference between vehicle-treated control and ESE-15-ol-treated samples. † indicates a t-test P-value <0.05 for difference between MCF-7 and MCF-12A ESE-15-ol-treated samples. ‡ indicates a t-test P-value <0.05 for difference between MCF-12A and MDA-MB-231 ESE-15-ol-treated samples.

