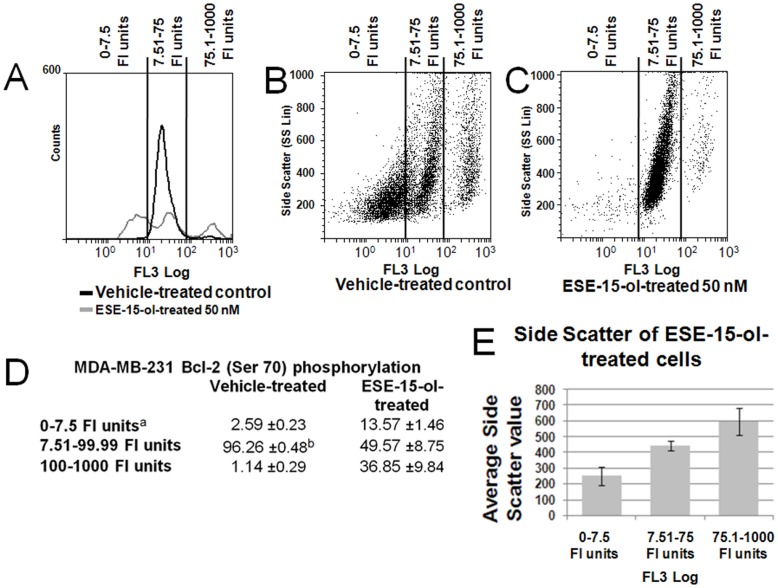
Figure 7. Effects of ESE-15-ol on Bcl-2 phosphorylation in MDA-MB-231 cells after 24 h exposure.
A) Flow cytometry histogram of Bcl-2 (Ser 70) relative quantity (FL3-log) in vehicle-treated and ESE-15-ol-treated (50 nM) MDA-MB-231 cells after 24 h exposure. Flow cytometry dot-plot of Bcl-2 (Ser 70) (FL3-log) relative quantity vs relative cellular complexity (SS lin) in B) vehicle-treated or C) ESE-15-ol-treated MDA-MB-231 cells. D) Percentage of cells in the FI unit ranges of 0–7.5, 7.51–99.99 and 100–1000 as an indication of the quantity of Bcl-2 (Ser 70) phosphorylation per cell. E) Bar-chart demonstrating the differences in cell size with different amounts of Bcl-2 (Ser 70) per cell. Means of three biological replicates are presented in bar charts. No differences in the overall Bcl-2 expression was observed (data not shown). a The fluorescence intensity of the FL3 filter is indicated by “FI units”. b Values are presented as the average ± SD.

