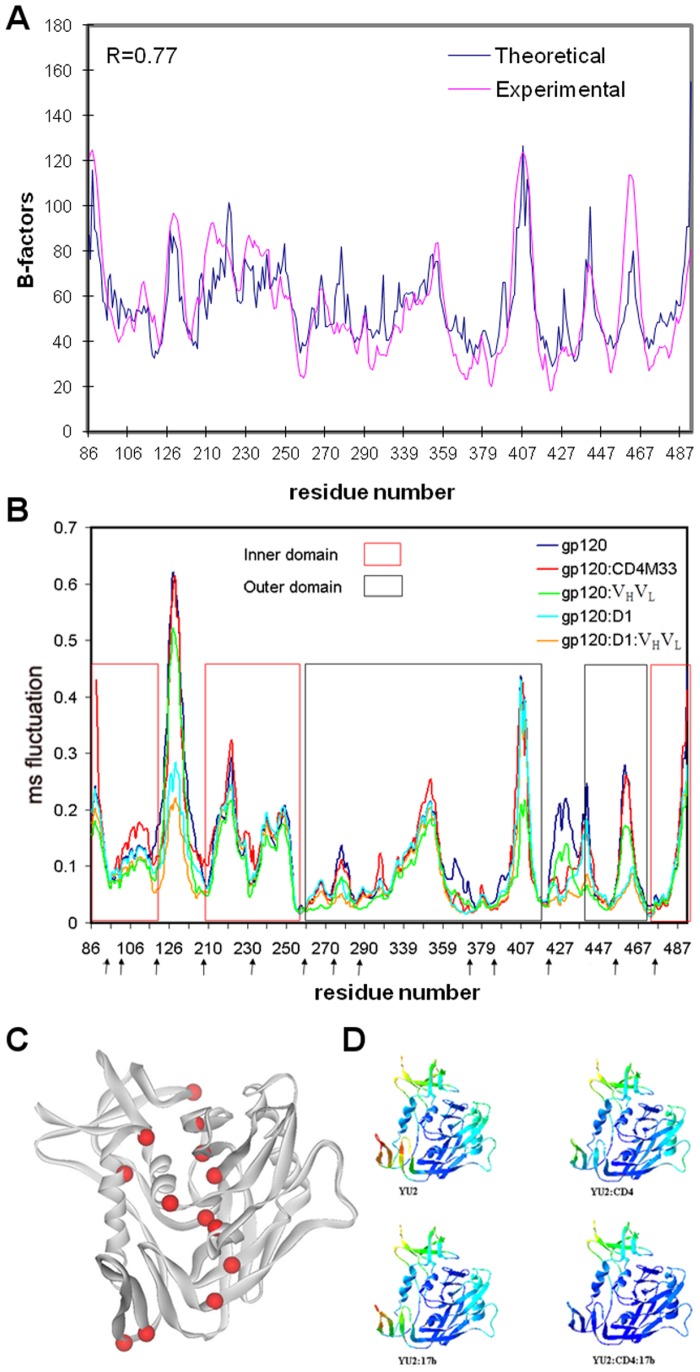
Figure 2. Collective motions in gp120 as computed by the ENM.
(A) Comparison of experimental and ‘theoretical’ B-factors (mean-square fluctuations) for the structure of core HIV-1 gp120:CD4(D1D2):Fab17b. Experimental B-factors are from the crystal structure (PDB ID: 1G9N) [10]; theoretical values derive from the mean-squared fluctuations, <|r – r0|2>, as summed from all modes from an isotropic ENM calculation from the entire gp120:D1:VHVL complex, noting that B = 8π2<|r – r0|2>/3. Thus, the ENM profile has been uniformly scaled to match the experimental data. The correlation coefficient between the two profiles, which is scale invariant, is 0.77. (B) Mean-square (ms) fluctuations represented by the frequency weighted sum of the 10 slowest modes. Analyses are from gp120 as isolated from the gp120:CD4∶17b complex and in various complexes as indicated in the color key. Arrows below the sequence place the hinge sites as determined from the analysis of gp120 in complex with the D1 domain of CD4 and the VHVL domains of antibody 17b. (C) The hinge sites (red spheres) mapped onto a ribbon drawing of the gp120 structure (grey). (D) Ribbon diagrams of the gp120 structure color-coded spectrally according to residue fluctuations. Red corresponds to the highest amplitudes and blue to the lowest amplitudes.

