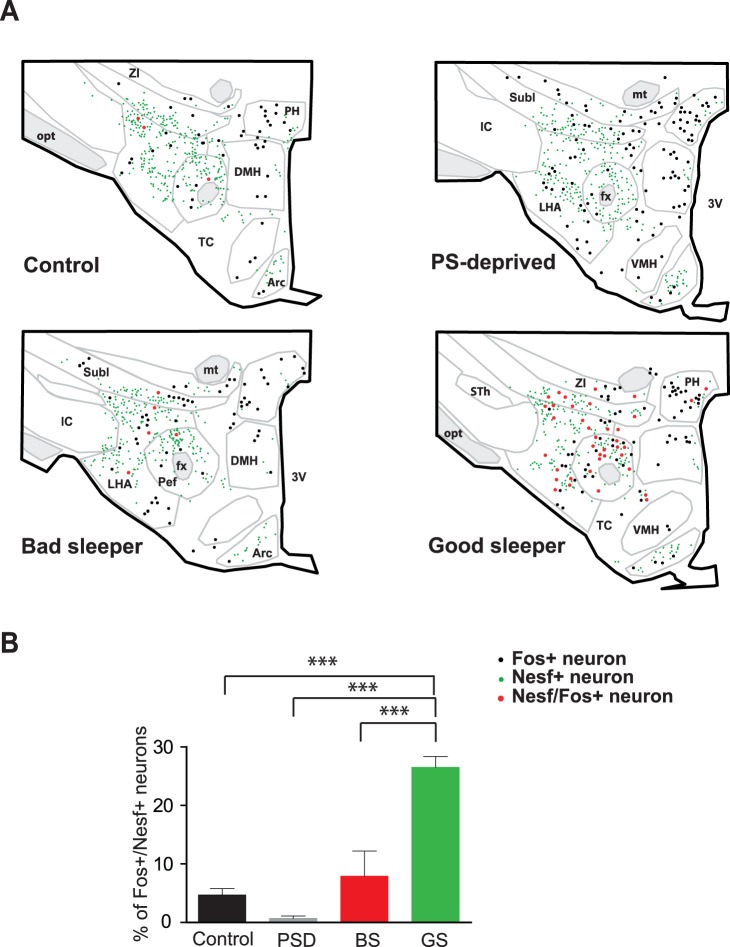
Figure 5. Nesfatin-1 neurons within THA are recruited during PS. A.
- Schematic drawings of frontal sections at the same THA level (AP = −3,30 mm according to Paxinos and Watson’s atlas) comparing the distribution of the Nesf-1+ (green dots), Fos+ (black dots) and Fos+/Nesf-1+ double-labeled (red dots) cell bodies plotted in a representative rat issued from the Control, PS-deprived, Bad-Sleeper or Good-Sleeper experimental samples. Each dot represents one labeled cell body. Notice the higher number of Fos+/Nesf-1+ neurons (red dots) in the ZI-Subl and the PeF-LHA areas in Good- compared to Bad-Sleepers. Both experimental groups were submitted to the same PS deprivation protocol and significantly differed only in PS amounts experienced during the last 2 h before sacrifice. B- Histogram showing that the mean percentage (± SEM) of Fos+/Nesf-1+ (vs. single Fos+) neurons is significantly higher in rats with intense PS rebound (Good-Sleepers, GS, n = 4) compared to the other three experimental conditions (Control, n = 5; PS-deprived, n = 5; Bad-Sleepers, n = 4). Data are presented as mean ± SEM. *** p<0.001 using a one way factor between subject ANOVA and post hoc Bonferonni test. Abbreviations: 3V, third ventricle; Arc, arcuate nucleus; DMH, dorsomedial hypothalamic nucleus; fx, fornix; IC, internal capsule; LHA, lateral hypothalamic; mt, mamillo-thalamic tract; opt, optic tract; Pef, perifornical nucleus; PH, posterior hypothalamic nucleus; Subl, subincertal nucleus; TC, Tuber cinereum; VMH, ventromedial hypothalamic nucleus; ZI, zona incerta.

