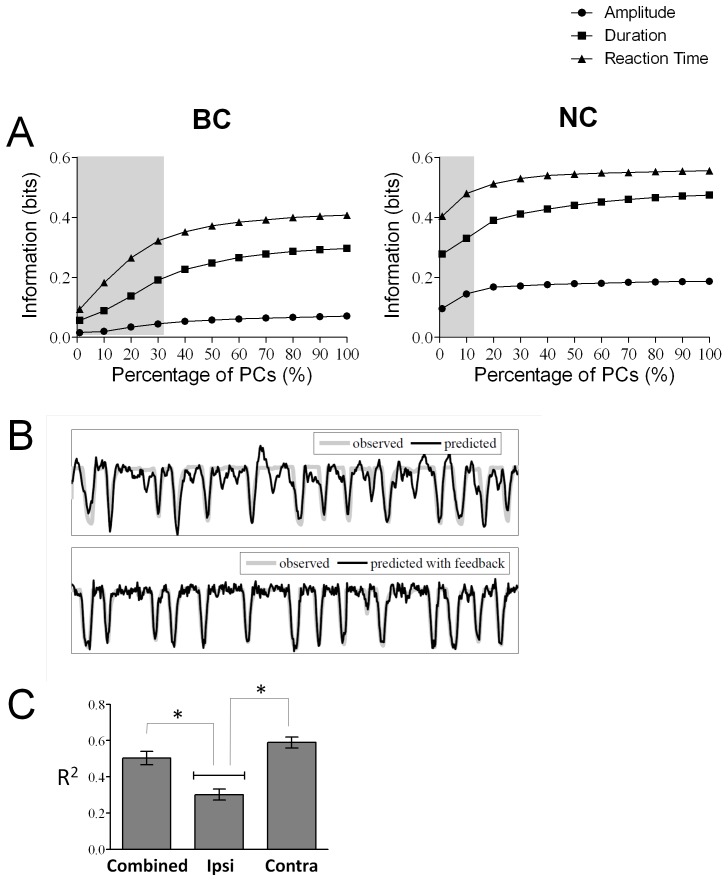
Figure 5. (A) Dimension reduction using principal component analysis.
The spike data from the single neurons was used to calculate the principal components (PCs) which were then used to decode information about the press in terms of the behavioral parameters, amplitude, reaction time and duration of press. The information that can be decoded is plotted as a function of the percentage of principal components used to find this information in BC mode (left panel) and NC mode(right panel). Grey rectangle represents minimal percentage of PCs needed such that the amount of information is not different when 100% of PCs are used. (B) Trajectory Reconstruction. An example of reconstruction of the trajectory of limb movement using Wiener filter from the BC mode. Comparison of the position of the hindlimb (grey) and its prediction using a linear wiener filter (black) without feedback (top panel) and with feedback of the position of the limb (bottom panel). (C) Comparing the prediction of trajectory using only the neurons from the contralateral side (brain hemisphere opposite to the limb that was used to press the pedal) to that of the ipsilateral side and when combining neurons from both sides of the cortex. The y-axis represents the R2 value between the predicted and actual trajectory for these three conditions- ipsilateral, contralateral and combined.

