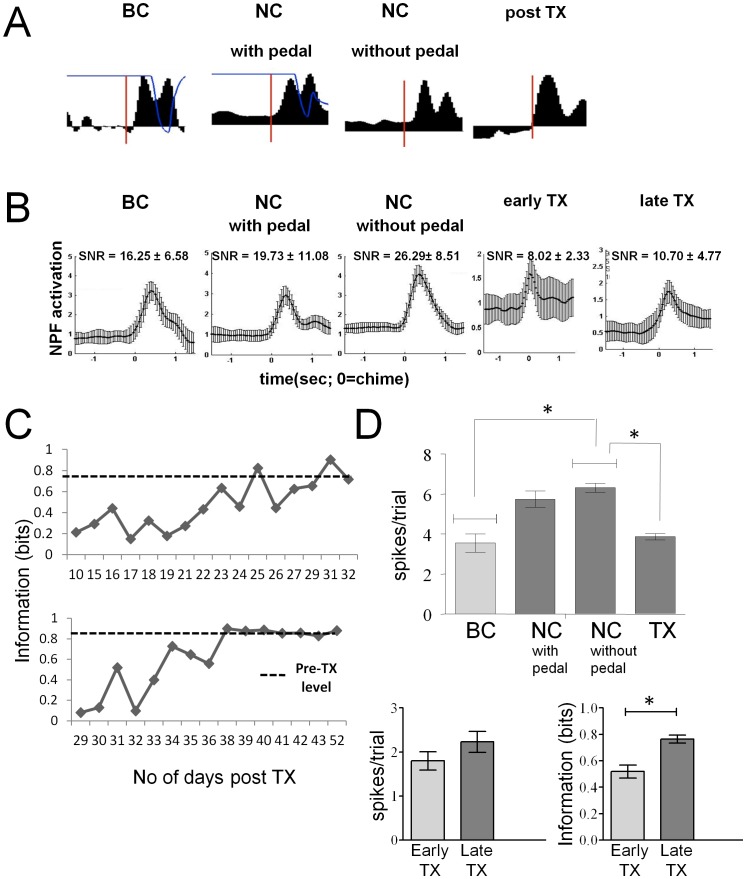
Figure 6. Impact of pedal removal and complete spinal transection on information conveyed by the neurons abut the motor program to press.
(A) A single trial neural population function plotted as a function of time for BC mode, NC mode with the pedal, NC mode without the pedal and post transection (TX). Thin line, over the population functions for BC and NC with pedal modes, is the output of the amplitude sensor. (B) The average neural population functions during a single recording day for BC, NC, NC without pedal, early and late TX stages. Number in each panel refers to the average signal-to-noise ratio (mean ± std). (C) Information as a function of absolute time post-TX. Top panel: This is the data from one of two animals that were returned to water restriction quickly and reintroduced into the task within 10 days post TX. Despite the quick return to the task, the neurons from this animal also initially conveyed small amount of information about the task but were able to reorganize within a similar time frame to convey information similar to that show during behavioural control (see dotted line). Bottom panel: This is the data from one of two animals that were slowly returned to water restriction schedules and introduced into the task 30 days post TX. It took approximately 10 days for the neurons to reorganize to convey information similar to that shown during behaviour control (dotted line). (D) Top panel: Comparison of the average response magnitudes of the single neurons during the task across the four modes. Bottom left panel: Comparison of the response magnitude of the single neurons during the early (first 30%) recording days after complete spinal transection to the late (last 30%). Bottom right panel: Comparison of the information about the motor program to press during the early recording days after TX to the late recording days.

