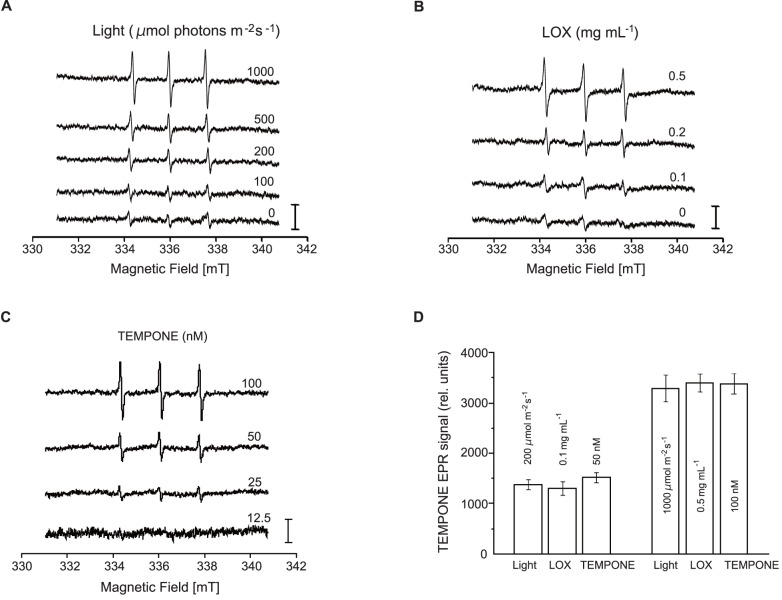
Figure 6. Production of 1O2 in PSII membranes by strong illumination and addition of lipoxygenase.
(A) TEMPONE EPR spectra were measured in PSII membranes exposed to strong illumination (intensity, 100–1,000 µmol photons m−2 s−1, illumination time 30 min). The illumination was performed in the presence of 50 mM TMPD, 500 µg chlorophyll mL–1 and 40 mM MES (pH 6.5). (B) TEMPONE EPR spectra were measured in PSII membranes treated with LOX (0.1, 0.2 and 0.5 mg mL−1). The LOX treatment was performed in the presence of 50 mM TMPD, 500 µg chlorophyll mL–1 and 25 mM phosphate buffer (pH 7). (C) TEMPONE EPR spectra measured in pure TEMPONE dissolved in DMSO. (D) Relative intensity of TEMPONE EPR spectra obtained after weak light (200 µmol photons m−2 s−1), LOX (0.1 mg mL–1), 50 nM TEMPONE and strong light (1,000 µmol photons m−2 s−1), LOX (0.5 mg mL–1), 100 nM TEMPONE. Signal intensity was evaluated as a relative height of the central peak. The vertical bars represent 1,200 relative units. The data are the means of three measurements±S. D.

