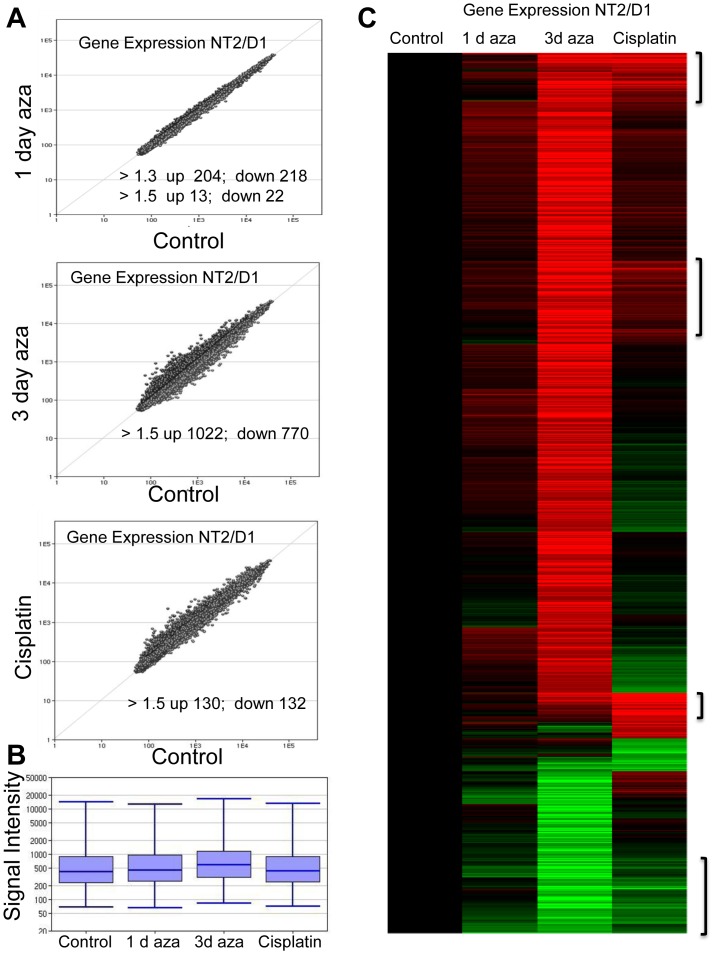
Figure 2. Low-dose 5-aza induces an early, robust, and unique reprogramming of gene expression in NT2/D1 cells.
A, Scatter plot of microarray gene expression differences in NT2/D1 cells. Each point represents the average of 3 biological replicates. Points above the diagonal line represent genes upregulated and points below the diagonal line repressed with 1 day 5-aza treatment (top), 3 day 5-aza treatment (middle), and cisplatin treatment (bottom), compared to control. The number of altered genes above the indicated thresholds were changed with p<0.05. B, Robust induction of gene expression occurs with low-dose 5-aza. Box-whisker plot of expression levels of genes (1296) changed among groups >1.2-fold and p<0.02 ANOVA, Benjamini Hochberg (BH) corrected indicated a upward shift in gene expression with 5-aza. C, Low dose 5-aza induced an early and unique program of gene expression compared to cisplatin. Unsupervised hierarchical cluster analysis of the expression profile of 5-aza and cisplatin altered genes was performed on the 898 genes (rows) altered between the samples (columns) more than 1.5-fold with p value<0.01 ANOVA, BH corrected. Upregulated gene are red, downregulated genes are green. Large overlap in 1 day and 3 day 5-aza treatments and distinct regulation compared to cisplatin is evident. Genes regulated in a similar manner by 5-aza and cisplatin are in brackets.

