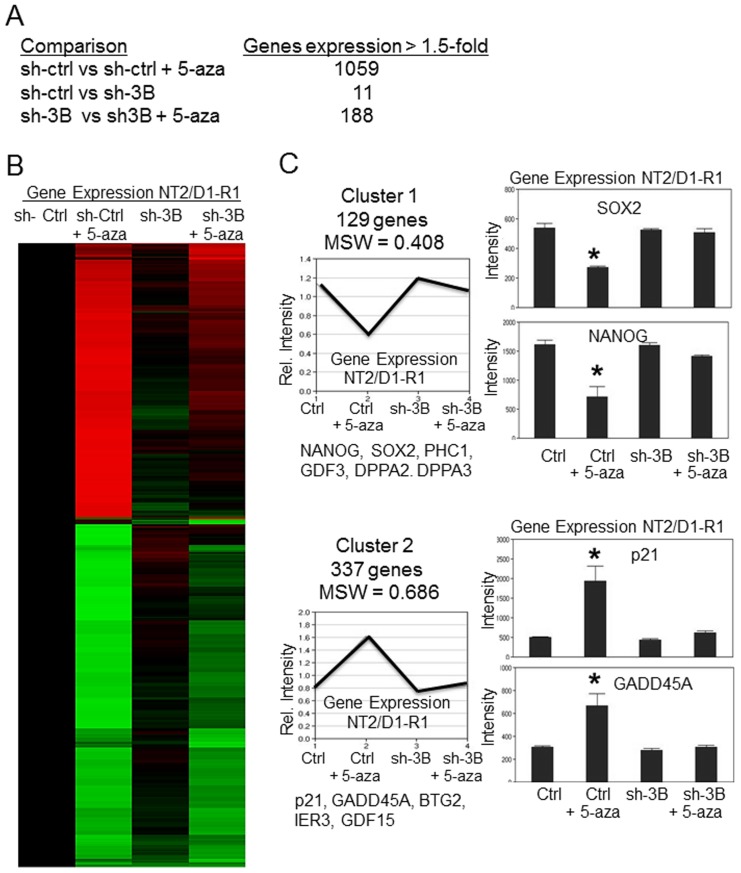
Figure 5. DNMT3B knockdown inhibits low-dose 5-aza mediated genome-wide activation of p53 target genes and repression of pluripotency genes.
A, Summary of results from expression microarray data of NT2/D1-R1 sh-control cells (sh-ctrl) and NT2/D1-R1 sh-DNMT3B cells (sh3B) untreated or treated for 3 days with 10 nM 5-aza. Knockdown of DNMT3B greatly reduced the number of genes altered with 5-aza treatment while DNMT3B knockdown alone results in minimal expression changes. The number of genes altered was based on the average of 3 biological replicates with 1.5-fold or greater change and a p value<0.01. B, Unsupervised hierarchical cluster analysis of the expression data in (A) was performed on the 541 genes altered more than 1.8-fold with p value<0.01 ANOVA BH corrected, between NT2/D1-R1 sh-control cells (sh-ctrl) and NT2/D1-R1 sh-DNMT3B cells (sh3B) untreated or treated for 3 days with 10 nM 5-aza. Upregulated gene are red, downregulated genes are green. C, Partitioning around mediods (PAM) analysis of 1169 genes changed 1.5-fold or greater with BH corrected p-value of <0.01. Cluster 1 and Cluster 2 of 6 total clusters are shown. All clusters are provided in supplemental Fig S4. The number of genes in the clusters and the mean silhouette width (MSW) value is indicated. Expression intensity values for representative genes in Cluster 1 (pluripotent genes) and Cluster 2 (p53 target genes) is provided on the right and additional prominent members are provided below each cluster. Error bars are S.E.M. * = p<0.05 compared to untreated control.

