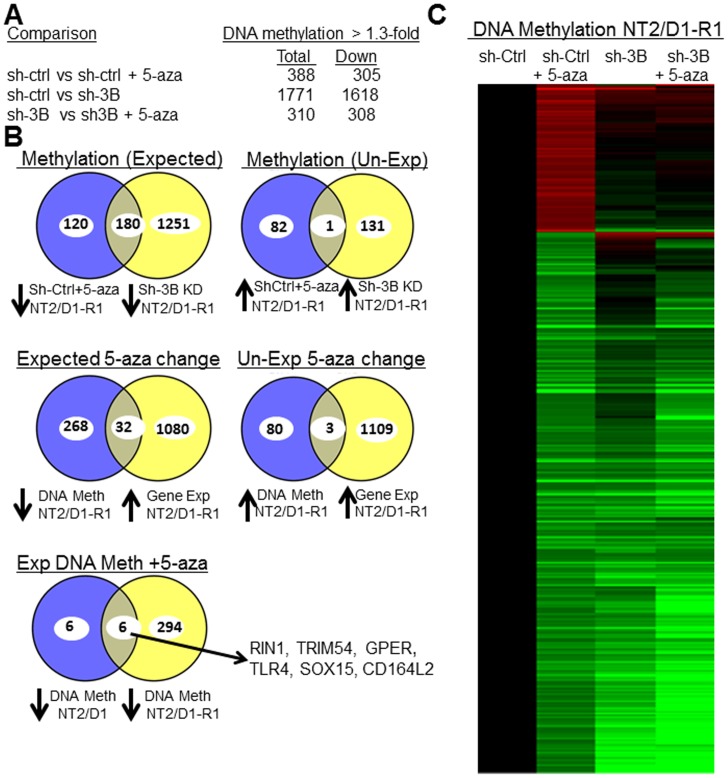
Figure 6. Low-dose 5-aza and DNMT3B knockdown alters genome-wide promoter demethylation in NT2/D1-R1 cells.
A, Summary of results from Illumina 27K beadchip DNA promoter methylation analysis of NT2/D1-R1 sh-control cells (sh-ctrl) and NT2/D1-R1 sh-DNMT3B cells (sh3B) untreated or treated for 3 days with 10 nM 5-aza. The number of promoter methylation alterations was based on the average of 3 replicates with 1.3-fold or greater change and a p value<0.05. B, Venn diagrams depicting degree of overlap in genes altered in expression or DNA promoter methylation in NT2/D1-R1 cells due to low dose 5-aza or DNMT3B knockdown. Top, High degree of overlap in genes in NT2/D1-R1 cells demethylated with low dose 5-aza and demethylated with DNMT3B knockdown (left). Little overlap in genes in NT2/D1-R1 cells undergoing increased DNA methylation with low dose 5-aza and increased DNA methylation with DNMT3B knockdown (right). The numbers represent methylation changes of 1.3-fold or greater with p<0.05. Middle, A moderate degree of overlap in genes in NT2/D1-R1 cells that underwent decreased DNA methylation and increased gene expression with 5-aza (left) and little overlap in genes in NT2/D1-R1 cells that underwent increased DNA methylation and increased gene expression with 5-aza. The numbers represent methylation changes of 1.3-fold or greater with p<0.05 and expression changes of 1.5-fold or greater with p<0.01. Bottom, A large degree of overlap in genes demethylated after 5-aza treatment of NT2/D1 and NT2/D1-R1 cells. The six overlapping genes are shown. The numbers represent methylation changes of 1.3-fold or greater with p<0.05. C, Unsupervised hierarchical clustering of the promoter DNA methylation of the 4 treatment arm values among just the 388 genes changed 1.3-fold or greater, p value<0.05 with 5-aza in the control cells depicting the large degree of overlap in genes undergoing demethylation with 5-aza and DNMT3B knockdown. Increased methylation = red, decreased methylation = green.

