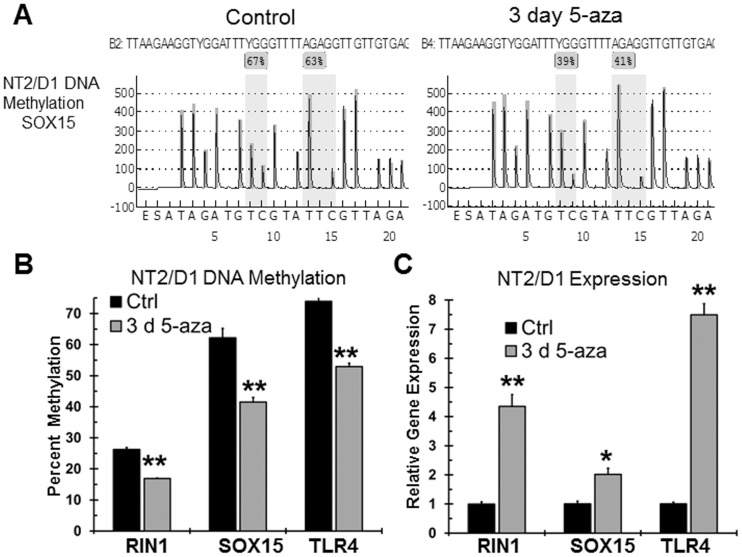
Figure 7. Confirmation of promoter DNA demethylation with low-dose 5-aza in NT2/D1 cells.
A, Representative bisulfite pyrosequencing tracing from NT2/D1 cells treated with vehicle control or 10 nM 5-aza for 3 days in the promoter region of SOX15. Shaded areas are CpG sites. B, Decrease in DNA methylation of the RIN1, SOX15 and TLR4 promoter with 3 day 10 nM 5-aza treatment of NT2/D1 cells as determined by bisulfite pyrosequencing. Average of biological triplicate determinations. Error bars are standard deviation. ** = p<0.005. SOX15 values represent the average methylation value across two CpG sites. RIN1 and TRL4 values represent the average methylation across three CpG sites. C, Increased gene expression of RIN1, SOX15 and TLR4 with 3 day 10 nM 5-aza treatment of NT2/D1 cells as determined by real-time PCR. Average of biological triplicate determinations. Error bars are standard deviation. * = p<0.05; ** = p<0.005.

