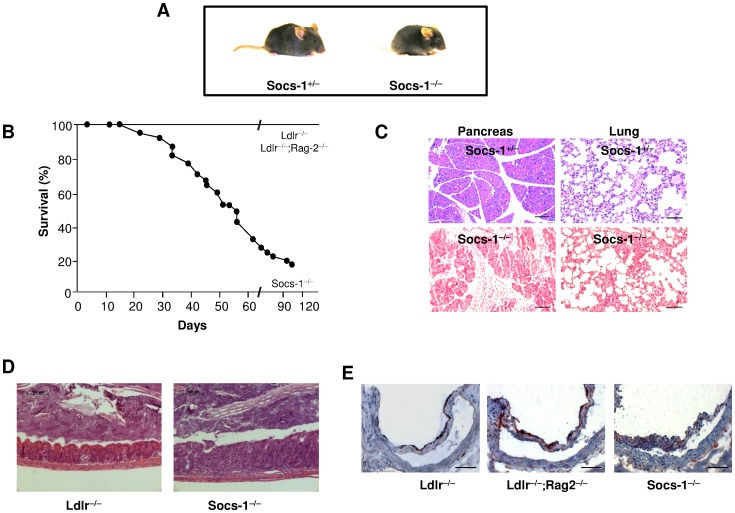
Figure 1. Impact of SOCS-1 deficiency on inflammation and survival. A.
Representative picture showing appearance of Socs-1−/−triple-KO mice compared to Ldlr−/−;Rag-2−/−;Socs-1+/− (Socs-1+/−) mice. B. Survival of Socs-1−/− triple-KO mice (N = 22) compared to Ldlr−/− and Ldlr−/−;Rag-2−/− animals (N = 40) demonstrating increased mortality of Socs-1−/−triple-KO mice C. Representative pictures (HE) of pancreas and lung of Socs-1−/− triple-KO mice compared to Socs-1+/− animals demonstrating increased, diffuse infiltration of mixed inflammatory cells (lymphocyte-like cells, and neutrophils) in both organs (scale bar 100 µm). D. Representative pictures (HE) of colon showing typhlitis in Socs-1−/− triple-KO mice compared to Ldlr−/−animals. E. Representative pictures of aortic roots derived from Ldlr−/−, Ldlr−/−;Rag-2−/− and Socs-1−/− triple-KO mice showing comparable macrophage infiltration without formation of atherosclerotic plaques under chow diet (scale bar: 50 µm).

