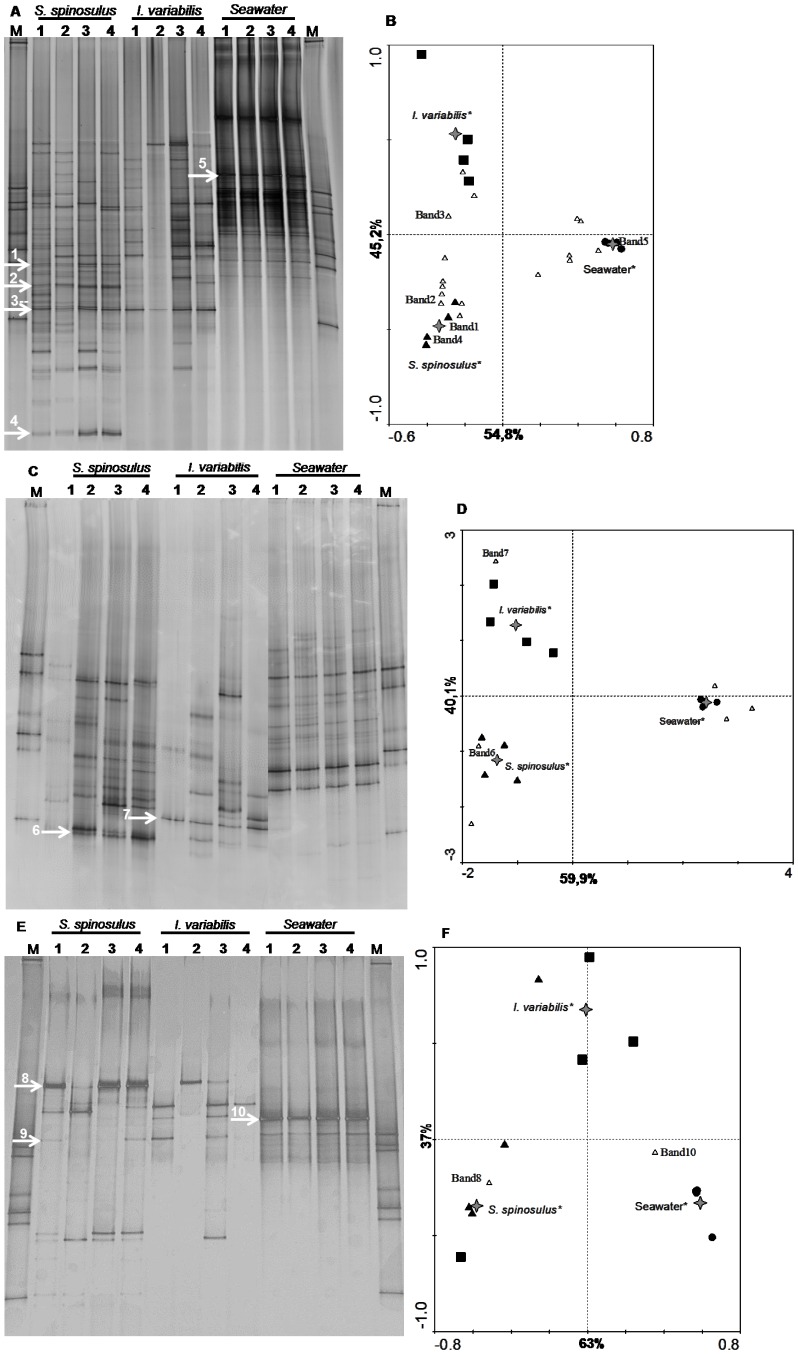
Figure 3. PCR-DGGE fingerprints and canonical analyses.
PCR-DGGE 16S rRNA gene fingerprints of S. spinosulus, I. variabilis and seawater DNA samples generated with “total-community” bacterial primers (A) and specific primer systems for Actinobacteria (C) and Alphaproteobacteria (E). The arrows indicate bands that were excised from DG-gels and sequenced. Corresponding ordination biplots of PCR-DGGE fingerprints and qualitative environmental variables are shown in panels B, D, F. Symbols: ▴ S. spinosulus, ▪ I. variabilis and • Seawater. Labels displayed on the diagram axes refer to the percentage variations of PCR-DGGE ribotypes - environment correlation accounted for the respective axis. The “star” symbols represent the centroid positions of the environmental variables in the diagram. Variables that significantly (p<0.05) influence the bacterial community composition are indicated by an asterisk.

