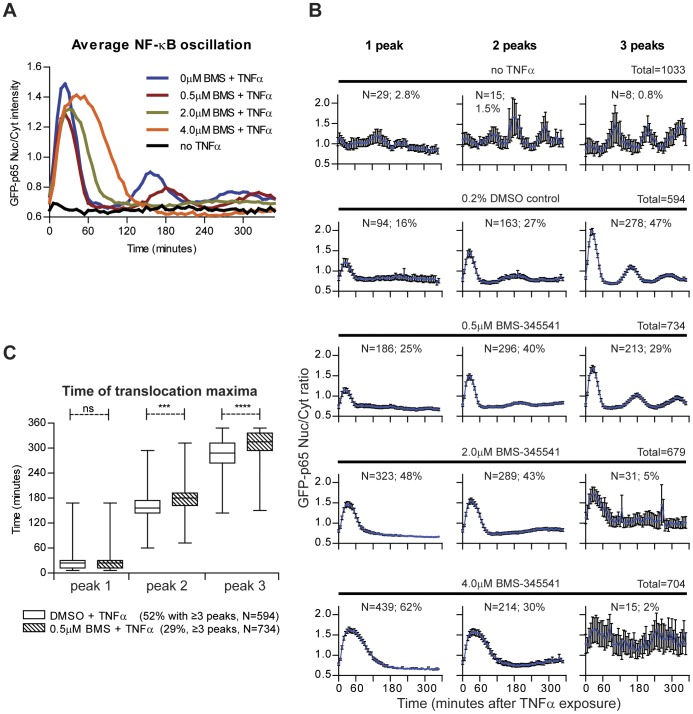
Figure 5. Population analysis of NF-κB nuclear translocation perturbation by the IKKβ inhibitor BMS-345541.
Cells were pre-treated for 2 hours with increasing concentrations of BMS-345541 before TNFα stimulation. (A) Average nuclear translocation response graphs, calculated from the translocation profiles of individual cells. (B) Average nuclear translocation response graphs with standard error bars for cells with one, two or three translocation peaks. The total number of cells, the number (n) and percentage of cells which show responding number of peaks are presented (C) Analysis of the time distribution of the median of 1st, 2nd and 3rd nuclear translocation maximum in TNFα stimulated and TNFα stimulated plus 0.5 µM BMS pre-treated cells. ns: No significant difference; *** p-value <0.001; **** p-value <0.0001.

