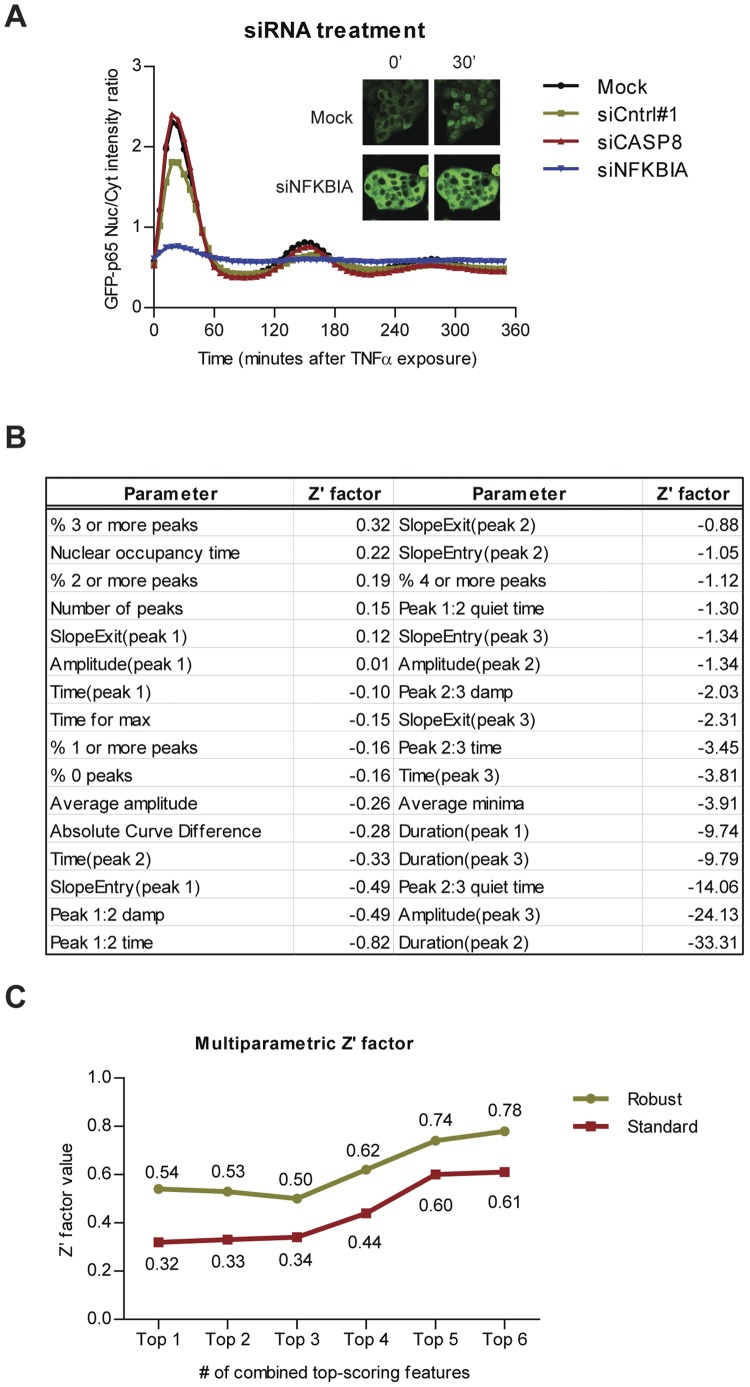
Figure 6. Application of the individual cell NF-κB nuclear translocation analysis in siRNA screening assays.
(A) The average nuclear translocation response graphs for negative controls siCASP8, siCntrl#1, transfection reagent without siRNA (mock), and positive control siNFKBIA. Inset: representative images of mock and siNFKBIA treated GFP-p65 cells, at 0 and 30 minutes after TNFα stimulation (B) Table showing the univariate Z'-factors of all 32 individual parameters. The definitions of the 26 analogue parameters are given in Table S2. Absolute Curve Difference: the absolute point-by-point difference between control and treatment averages. (C) Multivariate Z'-factor calculation based on top-scoring univariate Z'-factors. Both the conventional as well as the robust multivariate Z'-factors exceed the confidence threshold of 0.5 by combining ≥5 top-scoring univariate Z'-factors by linear projection.

