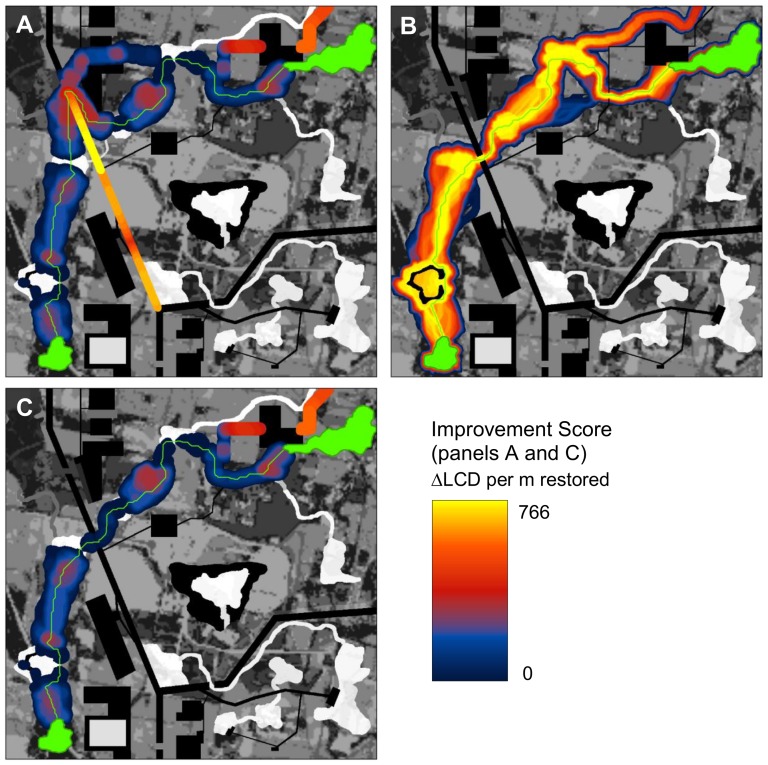
Figure 3. Barrier analysis of landscape.
(A) Improvement scores (ΔLCD) for a 60 m search diameter using an enhanced version of Linkage Mapper software ([40]). Only positive values (indicating barriers whose removal would reduce isolation) are shown. To facilitate visualization of the barriers, scores were mapped so that they filled the search window (i.e. the maximum ΔLCD value within the search radius of each pixel is displayed). The greatest improvement potential was detected crossing the highway. Note that a natural corridor is bisected by the highway at the point with the highest improvement potential (see detail in Figure 2). (B) Creating a new gap in the barrier where restoration potential is highest re-routes the modeled least-cost corridor and greatly reduces resistance between the patches (LCD = 78,503 weighted meters compared with an LCD of 124,443 pre-restoration). Best 20% of study area shown. (C) Barrier detection at 60 m search diameter after restoration.

