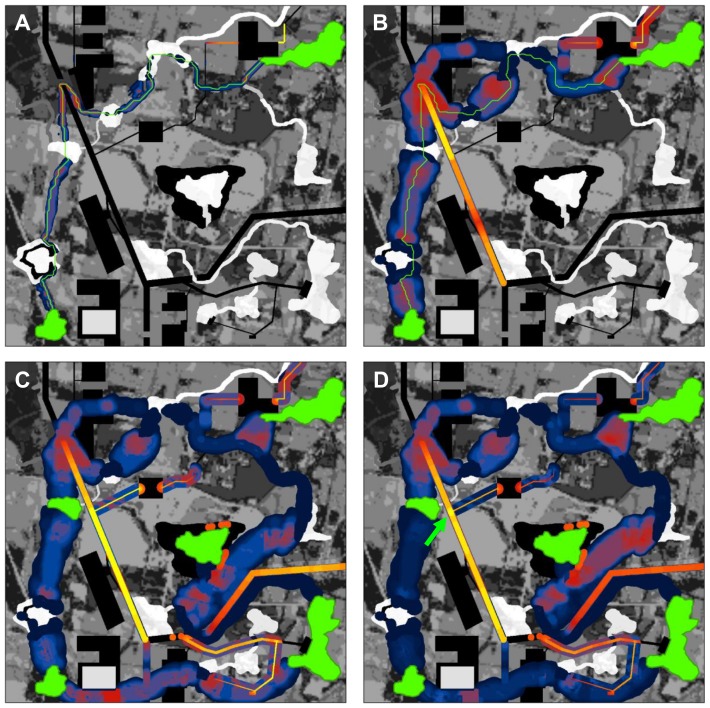
Figure 4. Barrier analyses integrating across multiple scales and patch pairs.
(A) Results of barrier analysis with original patch pair at 12 m search diameter, which detects restoration opportunities equal to or less than 12 m across (e.g., local roads). (B) Maximum per-meter improvement value across 10 search window sizes (from 6 m to 60 m, with 6 m steps between search diameters). The map highlights where actions at different scales would have highest impact per meter restored. (C) Maximum per-meter improvement value across same window sizes and 5 patches, showing where greatest improvement could be achieved for any single pair of patches. (D) Sum of improvement scores among 5 patches (green). As in Panels A–C, the maximum per-meter improvement score was calculated for each patch pair at each scale. These were then summed across patch pairs to incorporate cumulative benefit for multiple patch pairs across multiple scales. The area scoring highest (bright yellow) had high improvement scores for multiple patch pairs; we interpret this area as having high ‘barrier centrality,’ i.e. being an important restoration opportunity for keeping the overall network connected. Note that the area occurs at a road intersection; if practical, placing a wildlife crossing structure here would re-route four corridors connecting the two leftmost patches to both the central and upper-right patch.

