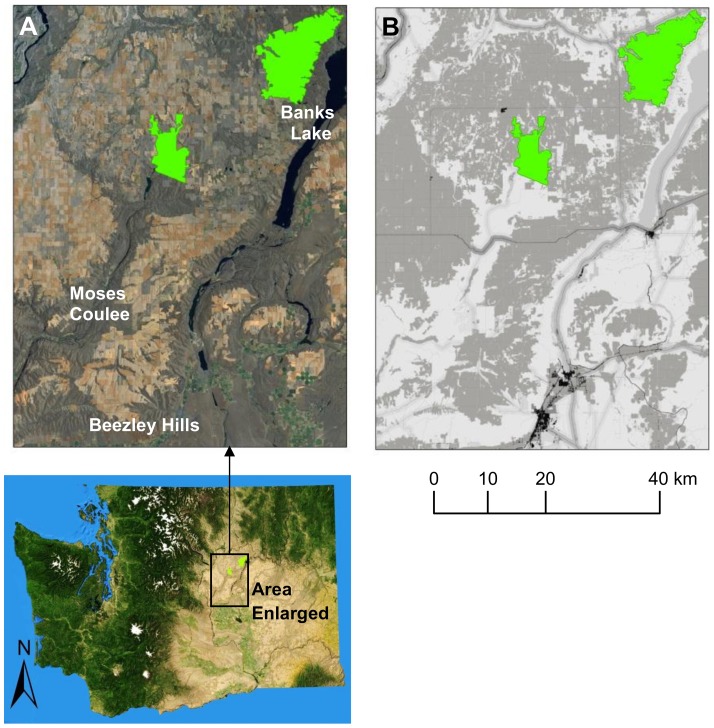
Figure 5. Corridor analysis in a landscape undergoing active conservation planning.
(A) 60 km by 80 km study area in eastern Washington, USA, containing two natural landscape blocks to be connected (green). (B) Resistance map used to model corridors in a recent multi-partner connectivity analysis across the Columbia Plateau Ecoregion [41]; values range from 1 (white) to 1000 (black). Low resistance areas include native grassland and shrub-steppe, whereas high resistance areas include roads, developed areas, and agriculture.

