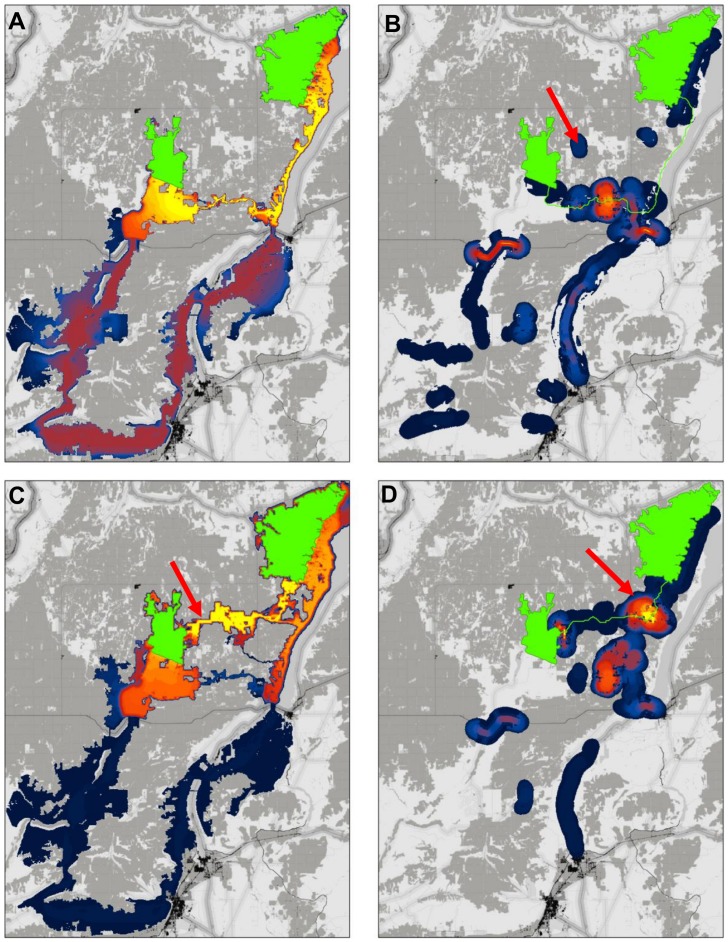
Figure 6. Reanalysis of connectivity modeling results using barrier detection algorithm.
(A) Corridor connecting natural landscape blocks, showing least-cost movement routes. Best 20% of study area shown. (B) Barriers detected at diameters from 200 m to 2 km, with original least-cost path shown in green for reference. Mitigating barriers along the least-cost path (i.e., intersecting the green line) would improve the existing corridor without changing its location; mitigating barriers away from the path would re-route the best modeled corridor. (C) Restoring a 1 km2 (500 m×2 km) swath spanning the barrier indicated by the arrow establishes a new least-cost corridor to the North. (D) A barrier analysis incorporating the simulated restoration indicates opportunities to substantially improve the new corridor with additional restorations.

