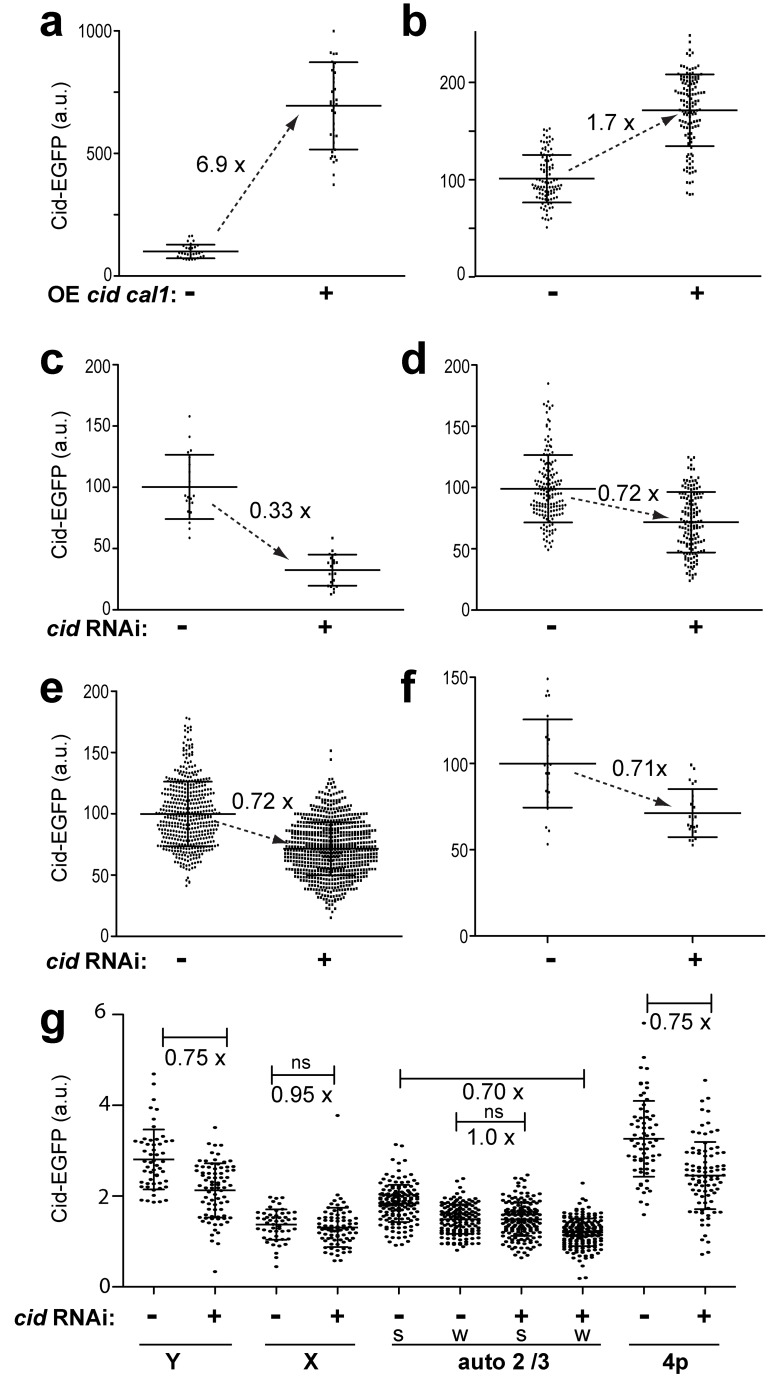
Figure 7. Transgenerational maintenance of Cid levels.
Experimentally, centromeric Cid-EGFP levels were either increased (a, b) or decreased (c–g) in sperm in a background producing only Cid-EGFP instead of endogenous Cid. Sperm with altered centromeric Cid-EGFP levels was used for progeny generation. Propagation of altered Cid-EGFP levels during progeny development was analyzed. (a) Comparison of the total amount of Cid-EGFP per sperm in males without (−) or with (+) bamP-GAL4-VP16-driven expression of UAS-cid-EGFP and UAS-cal1. (b) Comparison of the total amount of Cid-EGFP per nucleus in syncytial blastoderm embryos derived from males without (−) or with (+) increased Cid-EGFP in sperm as determined in (a). (c) Comparison of the total amount of Cid-EGFP per sperm in males without (−) or with (+) bamP-GAL4-VP16-driven expression of UAS-CidRNAi. (d–f) Comparison of the total amount of Cid-EGFP per nucleus in progeny derived from males without (−) or with (+) decreased Cid-EGFP in sperm as determined in (c) at different developmental stages: syncytial blastoderm (d), wing imaginal discs of third instar larvae (e), and sperm of adult males (f). Dots in (a–f) indicate total centromeric EGFP intensity per nucleus in arbitrary units (a.u.) chosen to result in an average intensity of 100 a.u. in the controls where Cid-EGFP was neither increased nor decreased in sperm. Averages (long horizontal line) are given with s.d. (short horizontal lines). n>22. The fold change of average Cid-EGFP levels between controls and experimental samples is indicated next to the dashed arrows. All the indicated differences were found to be highly significant (p<0.001, t test). (g) Comparison of Cid-EGFP levels in individual centromeres of Y (Y), X (X), major autosomes (2/3), and the paired chromosome 4 centromeres (4p) in S5 spermatocytes of adult progeny derived from P{w+, pUASt-mCherry-nls}III females mated to males without (−) or with (+) decreased Cid-EGFP in sperm as determined in (c). Each major autosome territory contains two Cid-EGFP spots. The stronger (s) and weaker (w) spots, respectively, were grouped and analyzed separately. Dots indicate centromeric EGFP intensity in arbitrary units (a.u.). Averages (long horizontal line) are given with s.d. (short horizontal lines). n>50. The fold change of average Cid-EGFP levels between controls and experimental samples is indicated below brackets. The corresponding differences of the averages are highly significant (p<0.001, t test) except for two nonsignificant cases (ns).

