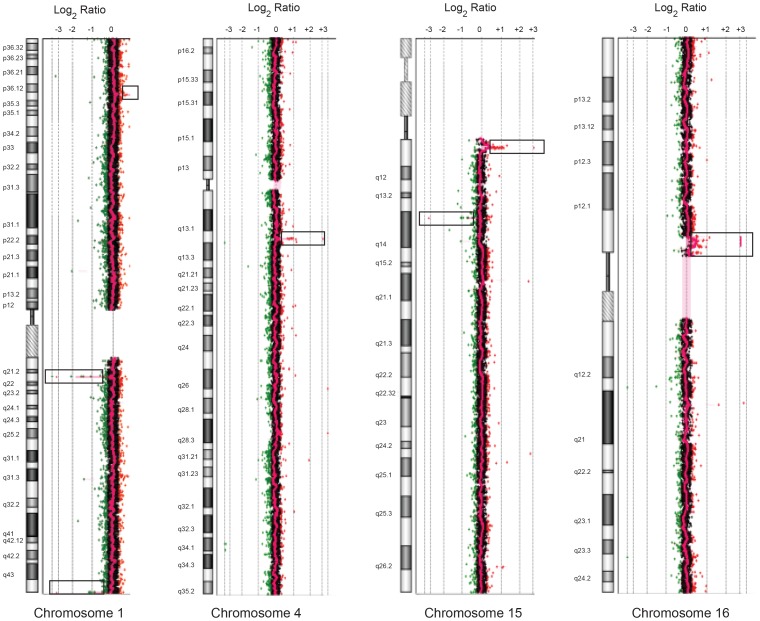
Figure 1. CNVs on chromosomes 1, 4, 15 and 16 of the index patient revealed by Agilent 244K human genome CGH microarray hybridization.
The profiles shown represent the averaged combined hybridization data of patient vs. reference DNA. Regions of gain and losses are boxed and depicted as positive or negative log2 ratios relative to the midline that denotes no gain/no loss of DNA sequences.

