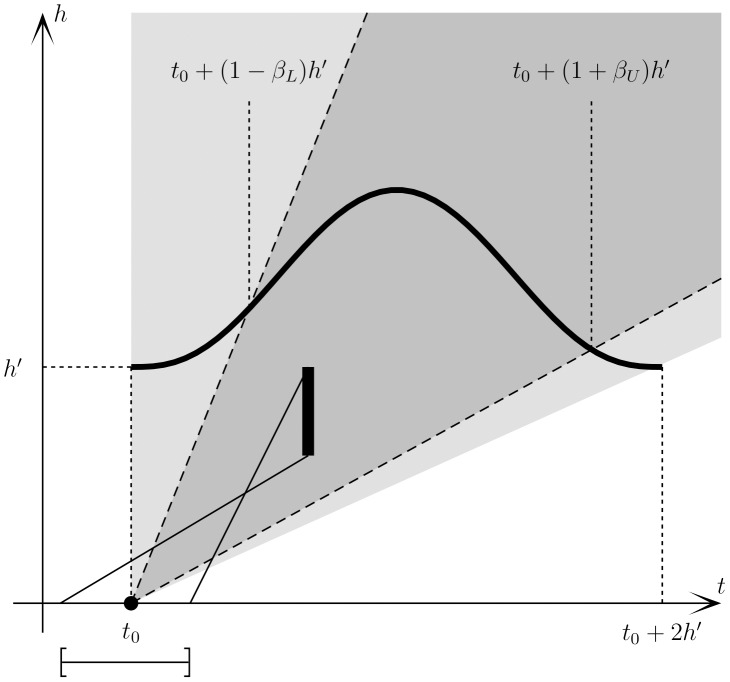
Figure 1. Schematic definition of the causal scale space.
An event at time  has a causal region in the light gray area and an effective causal region in the dark gray area between the dashed lines. If we detect significance in the interval shown by the vertical thick bar, the past causal region common to all points in this region of scale space infers an originating event in the region indicated by the horizontal bar below the t-axis, which encompasses the true event. The definitions of
  and
and  are illustrated by drawing the kernel at one scale
  . The definition of the effective causal region and hence the
  s follow accordingly as described in the text.

