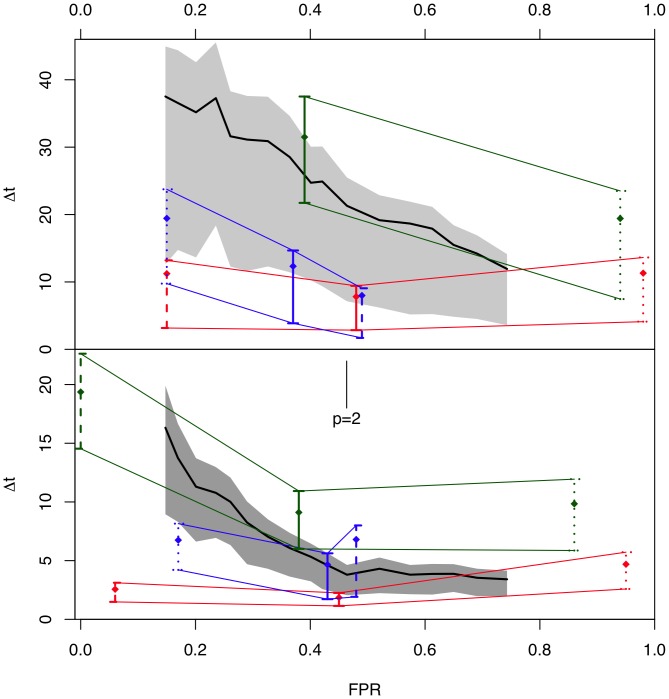
Figure 4. Detection of change in constructed time series.
The detection time for a small change ( , top panel) and large change (
 , bottom panel) versus false positive rate for the c-SiZer algorithm with p in the range 20 (left in plot) through 0.5 (right in plot). The mean detection time is shown as black line for the two cases, while the surrounding shaded regions show the 30/70 percent quantiles for the fitted
  distribution. The FPR for
  is indicated. The colored lines show the corresponding values for the comparison algorithms cpt (red), bayes (blue), and cusum(green) for three different binwidths,
  with (dashed, full, dotted) lines. Note that for cusum, the
  change is never detected using binwidth
  .
.

