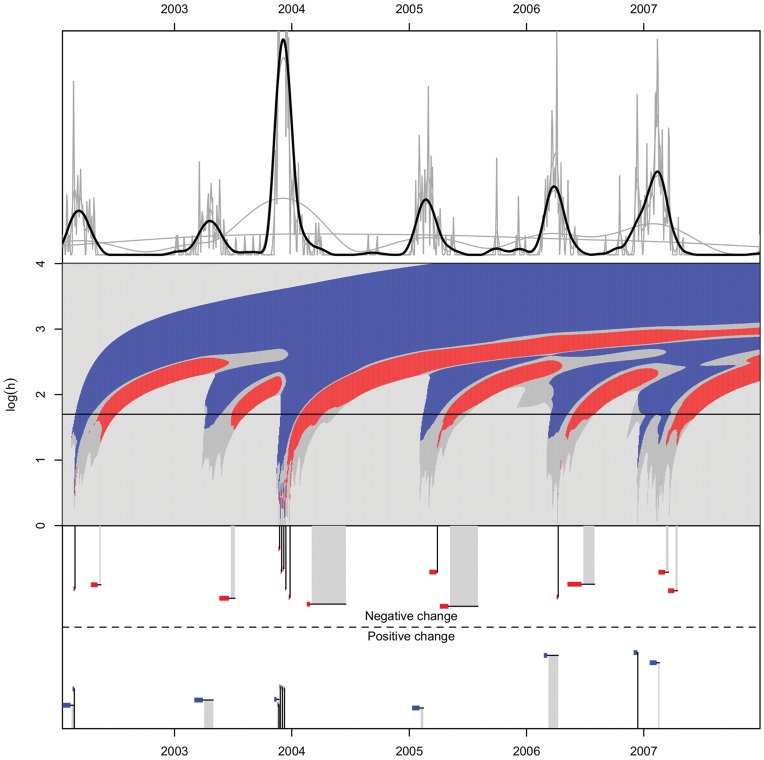
Figure 7. c-SiZer KDE analysis of the number of confirmed laboratory cases of influenza A in North Norway in the period 2002–2007.
The structure of the figure is as in Figure 6. The regular recurrence of the influenza is clearly shown. Also note that the large outbreak in the 2003/2004 season give significance on details in the plot due to test patterns in the laboratory and the high volume of data here.

