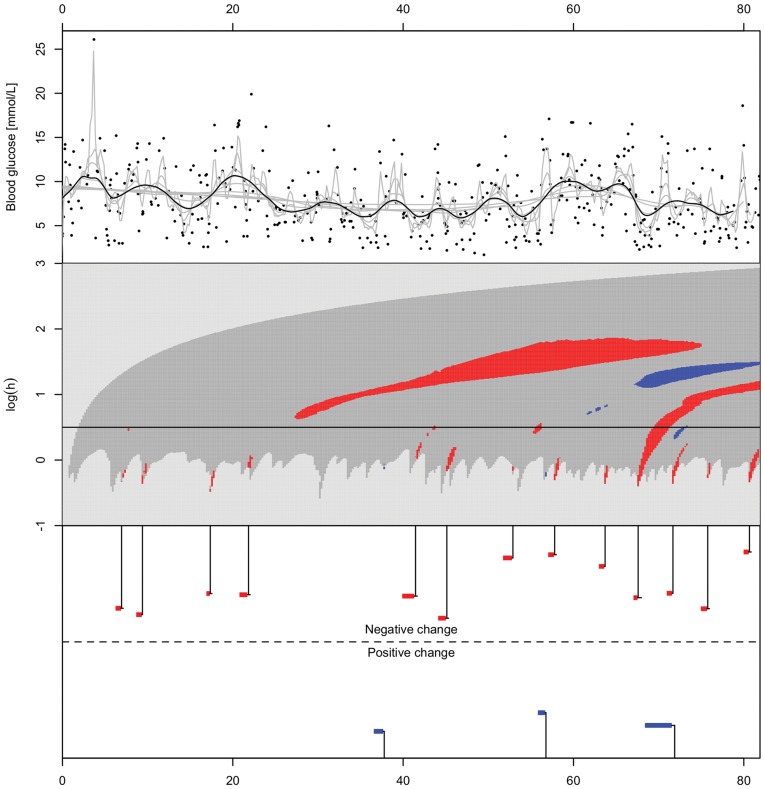
Figure 8. Blood glucose measurements for one patient with type 1 diabetes over 82 days, along with c-SiZer regression analysis.
The structure of the figure is as in Figs 6 and 7. The raw data are self-measured blood glucose with time stamp resolution of one second as reported by the blood glucose meter.

