
Figure 3. ICM:TE was significantly decreased in embryos from obese males while total cell number was unchanged.
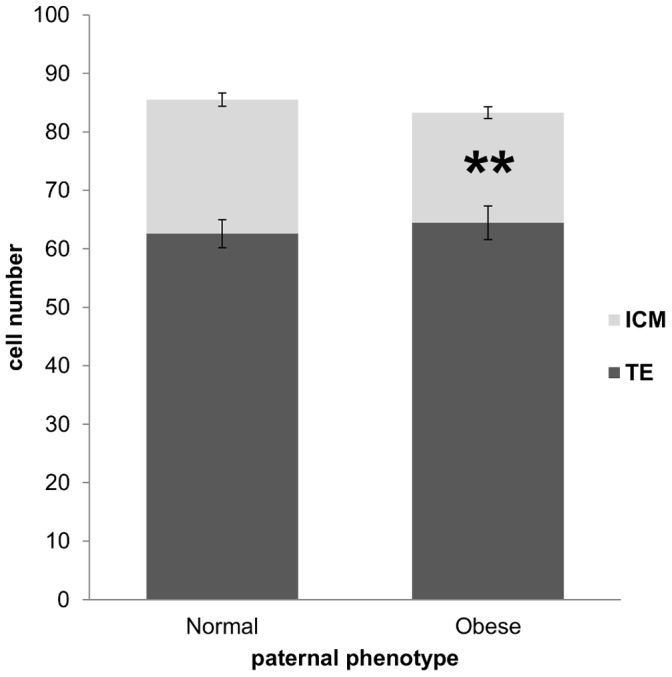
The dark portion of the bars represents the average number of trophectoderm cells and the light portion the average number of inner cell mass cells. Data are expressed as mean ± SEM. ** P<0.01, n = 60 embryos per paternal group.