
Figure 2. Lifespan of BubR1 +/GTTA is reduced.
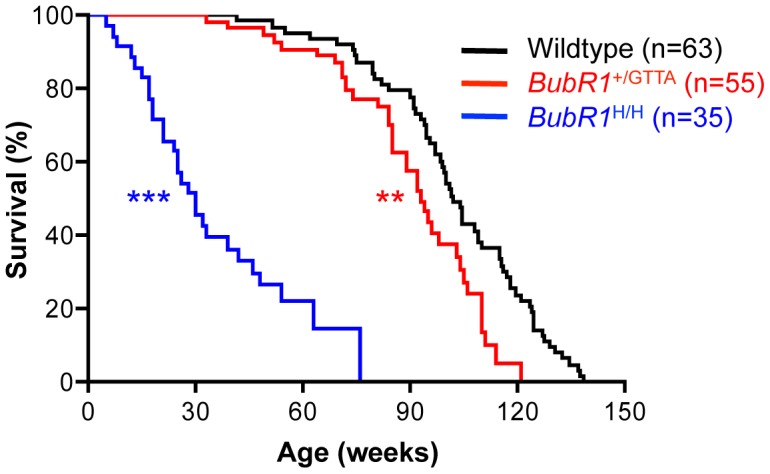
Kaplan-Meier overall survival curves. Asterisks denote significance compared to wildtype mice using a log-rank test: **P<0.01 and ***P<0.001. The maximum lifespan was significantly decreased in BubR1 +/GTTA compared to wildtype (P = 0.0008; two-sided Wang/Allison test referring to the ratio of mice alive per genotype at the 90th percentile survival point) [70].