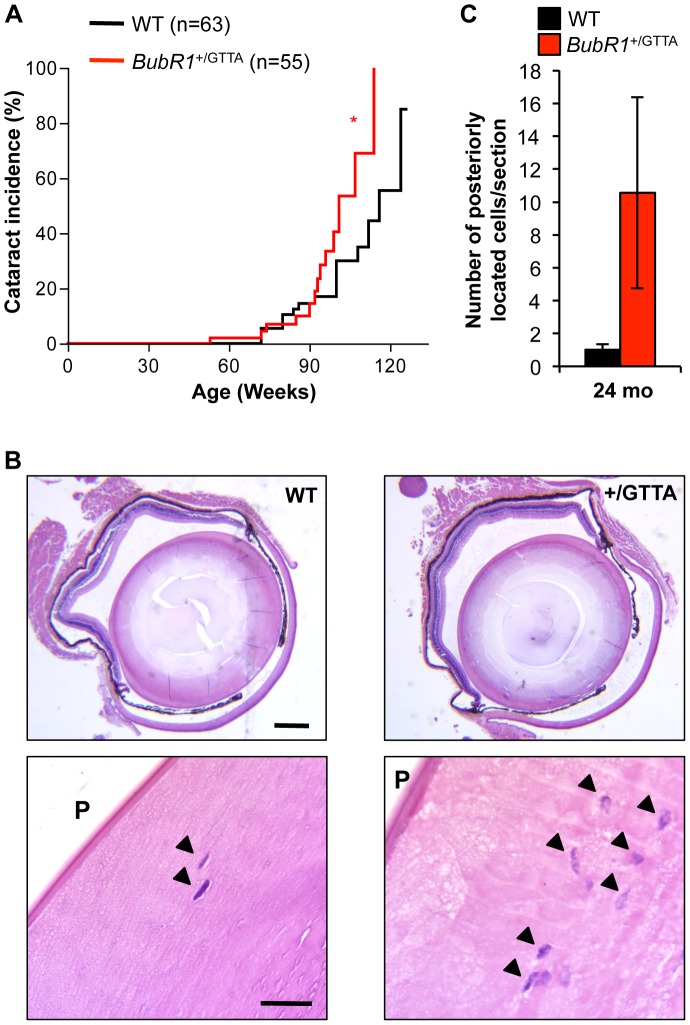
Figure 4. Cataract formation is accelerated in BubR1 +/GTTA mice.
(A) Incidence and onset of cataracts in BubR1 +/GTTA and wildtype mice. Eyes were dilated and screened for cataracts using a slit light. A log rank test was used for statistical analysis: *P<0.05. (B) Representative cross sections of cataractous lenses stained with hematoxylin and eosin. Note that the BubR1 +/GTTA lens section contains more posteriorly located (arrowheads). Scale bars represent 2 mm and 100 µm. (C) Quantitation of posteriorly (P) located epithelial cells in cross sections of cataractous lenses. Error bars represent SEM. In C we used: n = 10 wildtype and n = 9 BubR1 +/GTTA 24-month-old animals.

