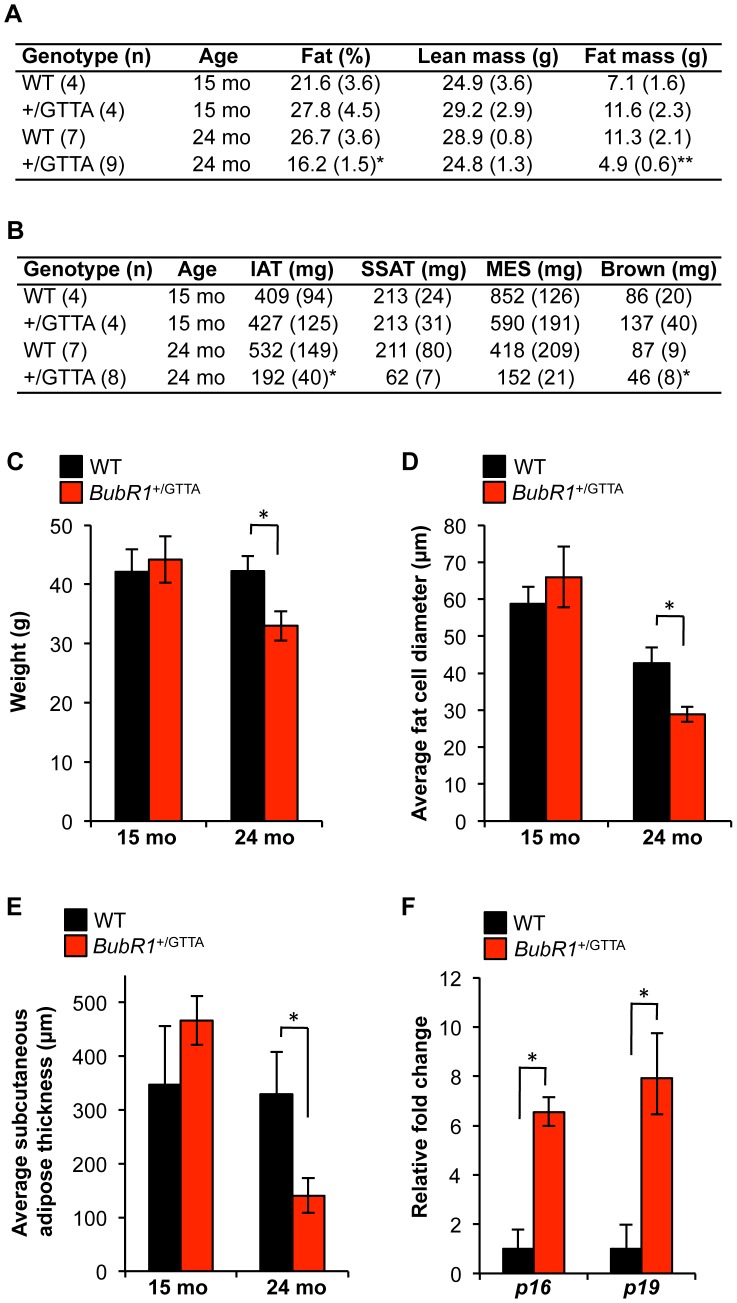
Figure 5. Age-related fat loss in BubR1 +/GTTA mice.
(A) Body fat percentage, lean mass and fat mass of wildtype and BubR1 +/GTTA mice measured by DEXA scanning. (B) Fat depot sizes in wildtype and BubR1 +/GTTA mice at the indicated ages. (C) Body weight of wildtype and BubR1 +/GTTA mice at the indicated ages. (D) Average fat cell diameters in IAT of mice at the indicated ages. (E) Average subcutaneous adipose layer thickness of lateral skin of the indicated mice. (F) Expression of p16 Ink4a and p19 Arf in gastrocnemius muscles of 24 month-old mice analyzed by qRT-PCR. For all analyses error bars represent SEM. For C-F we used: n = 4 15-month-old wildtype and BubR1 +/GTTA males; n = 7 24-month-old wildtype males; and n = 8 BubR1 +/GTTA 24-month-old males. An unpaired t-test was used for statistical analysis in A–F: *P<0.05 and **P<0.01.

