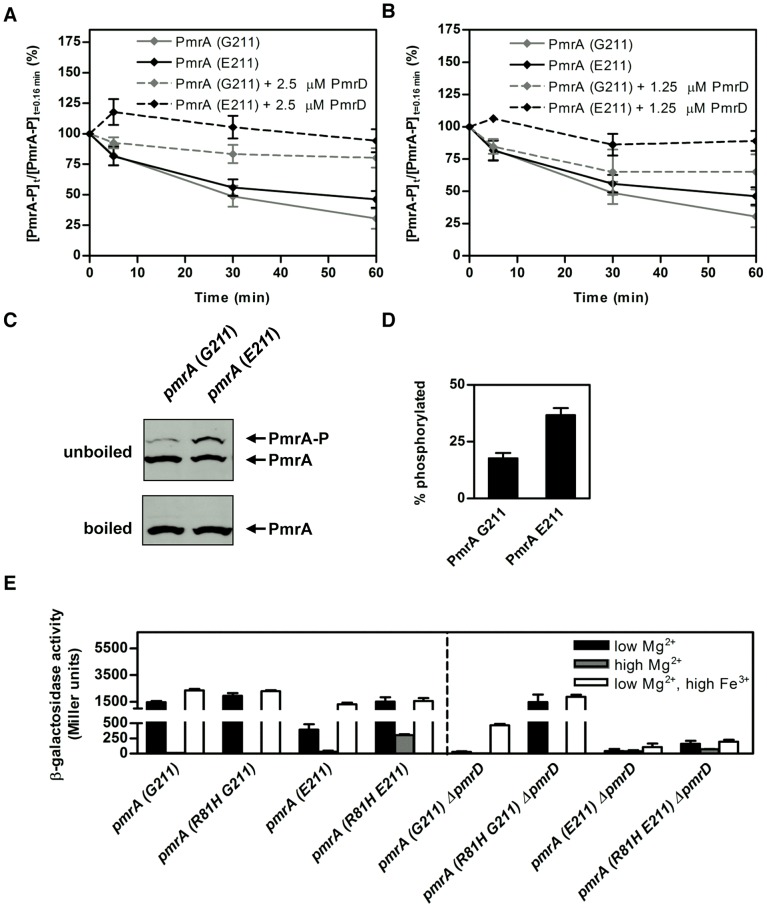
Figure 5. PmrA-P levels are higher in S. typhimurium pmrA (E211) than in S. typhimurium pmrA (G211) experiencing PmrD- and PmrA-inducing conditions.
(A–B) Levels of PmrA-P following incubation of PmrA (G211)-P or PmrA (E211)-P (10 µM) with PmrBc (5 µM) in the presence of 2.5 µM (A) or 1.25 µM (B) PmrD for the indicated times. The graph depicts the level of PmrA-P at the indicated times relative to levels at the start of the reaction. Data correspond to the mean values of at least three independent experiments and error bars show standard deviation. (C) Levels of phosphorylated versus unphosphorylated PmrA protein determined by Phos-tag gel analyses from S. typhimurium expressing C-terminally HA-tagged versions of the PmrA (G211) (EG18052) or PmrA (E211) (DC53) proteins. Bacteria were grown in N-minimal medium at pH 7.7 with low Mg2+ (i.e., 10 µM) and high Fe3+ (i.e., 100 µM). The total amounts of PmrA protein were determined on the same gels by boiling the samples to hydrolyze the phospho-Asp from PmrA-P. (D) Quantitation of the Western blot analyses shown in (C). The graph depicts the level of PmrA-P relative to total PmrA protein. Data correspond to the mean values of four independent experiments and error bars show standard deviation. These results are significantly different as determined by a two-tailed Student t-test (p<0.05). (E) β-galactosidase activity (Miller units) produced from a pbgP-lac transcriptional fusion in the following S. typhimurium 14028s strains: pmrA (G211) (EG9241), pmrA (R81H G211) (DC294), pmrA (E211) (EG11775), pmrA (R81H E211) (DC296), pmrA (G211) ΔpmrD (EG14331), pmrA (R81H G211) ΔpmrD (DC302), pmrA (E211) ΔpmrD (DC300), pmrA (R81H E211) ΔpmrD (DC304). Bacteria were grown in N-minimal medium at pH 7.7 with low Mg2+ (i.e., 10 µM), high Mg2+ (i.e., 10 mM) or low Mg2+ (i.e., 10 µM) and high Fe3+ (i.e., 100 µM). Data correspond to the mean values of three independent experiments performed in duplicate, and error bars show standard deviation.

