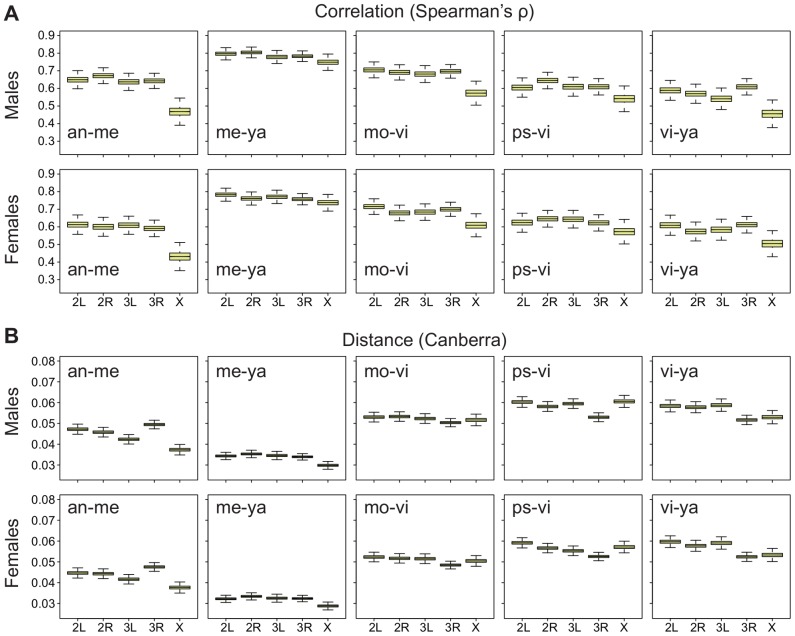
Figure 8. Divergence on the X in adults is greater using Spearman's.
 , but not the Canberra distance. Bootstrapped distributions of A, Spearman's
  (divergence is
  ) and B, the mean Canberra distance across chromosomes in Drosophila males and females for a selection of pair-wise species comparisons (all pair-wise comparisons are shown in Figures S8, S9).

