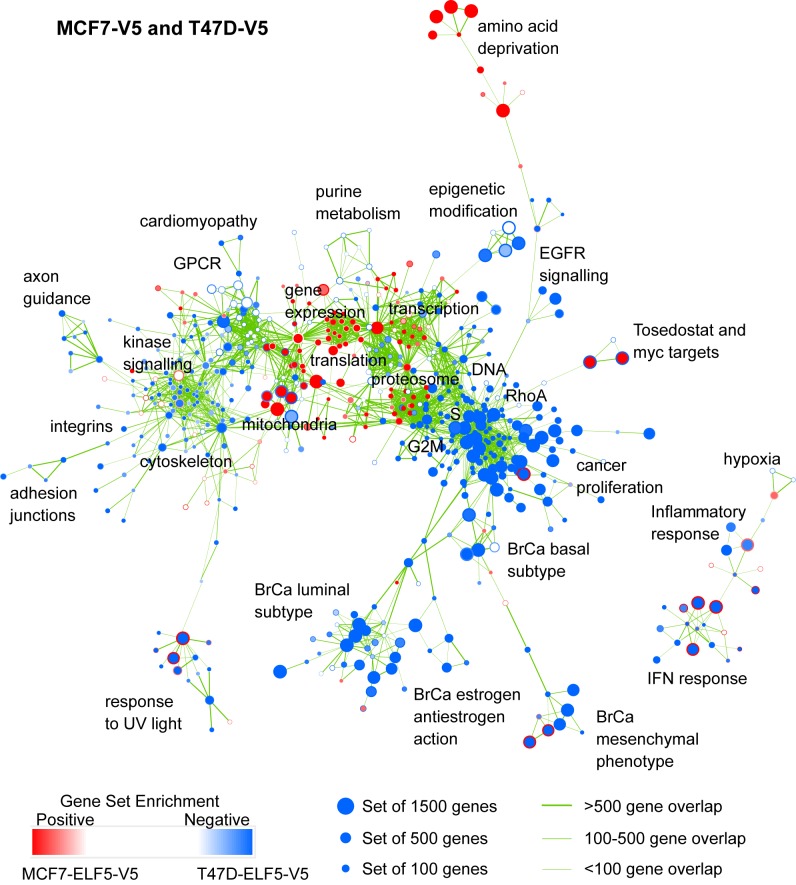
Figure 2. Visualization of the transcriptional functions of ELF5 in breast cancer.
Affymetrix transcript profiling following induction of ELF5 in T47D and MCF7 luminal breast cancer cells, analysed by LIMMA and GSEA. Results are visualized using the enrichment map plug-in for Cytoscape. Each circular node is a gene set with diameter proportional to the number of genes. The outer node color represents the magnitude and direction of enrichment (see scale) in T47D cells, inner node color enrichment in MCF7 cells. Thickness of the edges (green lines) is proportional to the similarity of gene sets between linked nodes. The most related clusters are placed nearest to each other. The functions of prominent clusters are shown. The network can be examined in detail using the scalable PDF in Figure S4.

