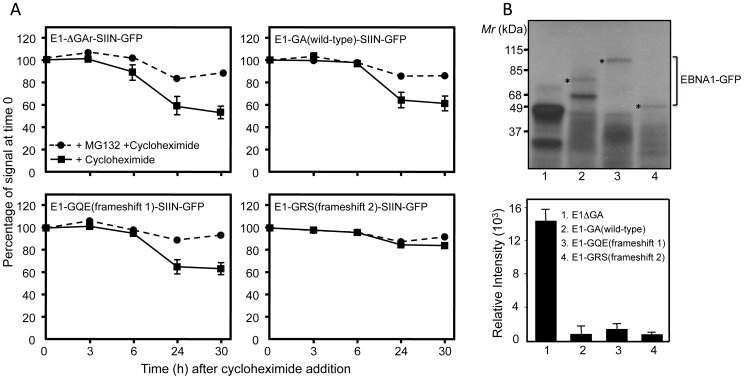
Figure 4. Intracellular degradation kinetics and expression of alternative EBNA1 repeat peptide sequences.
A, 293KbC2 cells were transfected with the following expression constructs E1ΔGA-SIIN-GFP; E1-GA(wild-type)-SIIN-GFP; E1-GQE(frameshift 1)-SIIN-GFP or E1-GRS(frameshift 2)-SIIN-GFP in the presence or absence of the proteasome inhibitor MG132 (10 µM). At 24 h post-transfection, the cells were incubated with cycloheximide (50 µg/ml) and then monitored over a 30-h time course as described in the Materials and Methods. EBNA1-SIIN-GFP expression of the cells at each time point was monitored by flow cytometry and plotted as the relative change in the levels of EBNA1-GFP expression following the addition of cycloheximide at time point 0. B, In vitro translation (IVT) assay of pcDNA3 expression constructs encoding E1ΔGA (lane 1), E1-GA(wild-type) (lane 2), E1-GQE(frameshift 1) (lane 3) or E1-GRS(frameshift 2) (lane 4).The constructs were transcribed and translated in vitro with T7 RNA polymerase by using a coupled transcription/translation reticulocyte lysate system. 35S-methionine-labeled proteins were visualized by autoradiography (upper panel). An asterisk indicates the full-length translation product of each EBNA1 frameshift variant. Band intensities from the IVT assay were quantified by densitometric analysis using Imagequant software (Molecular Dynamics) and graphed to demonstrate absolute intensities (lower panel). These data are representative of three separate experiments.

