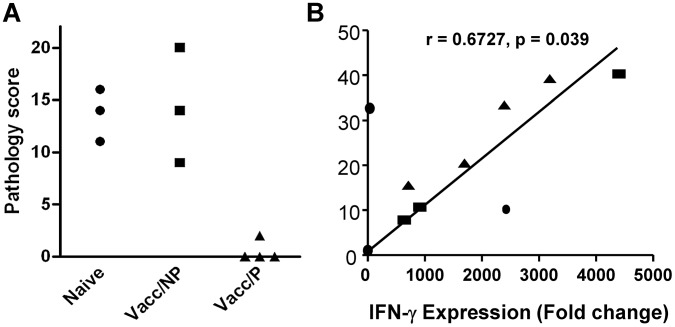
Figure 1. Protection and in vitro IFN-γ responses prior to challenge.
A. Individual pathology scores are shown for the animals used in this study. Naïve animals = no vaccination, Vacc/NP = vaccinated calves that were not protected; Vacc/P = vaccinated calves that were protected. B. Correlation of IFN-γ protein production in culture supernatants measured by Bovigam ELISA (y-axis) and ifn-γ gene expression as determined by deep sequencing (x-axis). Data are shown from PPD-B stimulated PBMC from individual animals. Supernatants and RNA were prepared after 24 h culture.

