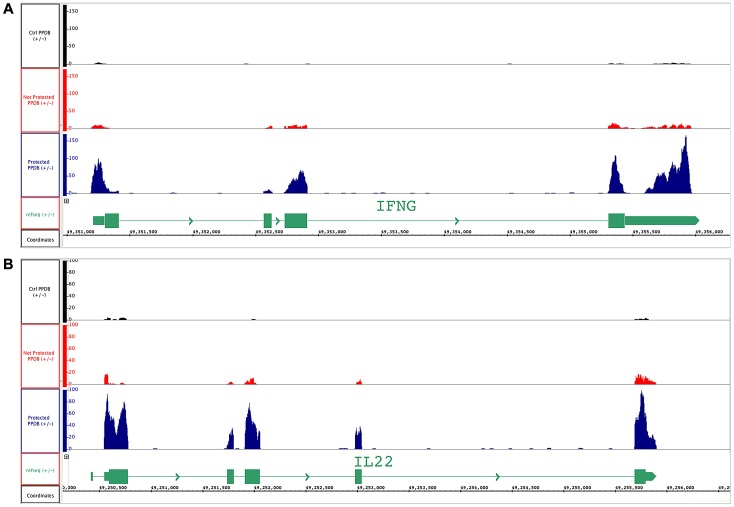
Figure 3. BCG-vaccinated and control cattle samples mapped to ifn-γ and il-22 genes.
Visualization by IGB of RNA sequencing reads of representative PPD-B stimulated PBMC from vaccinated-protected, vaccinate-un-protected and non-vaccinated control cattle. Y-axis shows the number of reads covering each base along the transcript in RPKM expression values for each sample. Black track: unvaccinated control cattle; red track: vaccinated/un-protected cattle and blue track: vaccinated/protected cattle. The schematic representation of transcript for (A) ifn-γ and (B) il-22 is show in green at the bottom of the each figure; the boxes show the exons of the gene.

