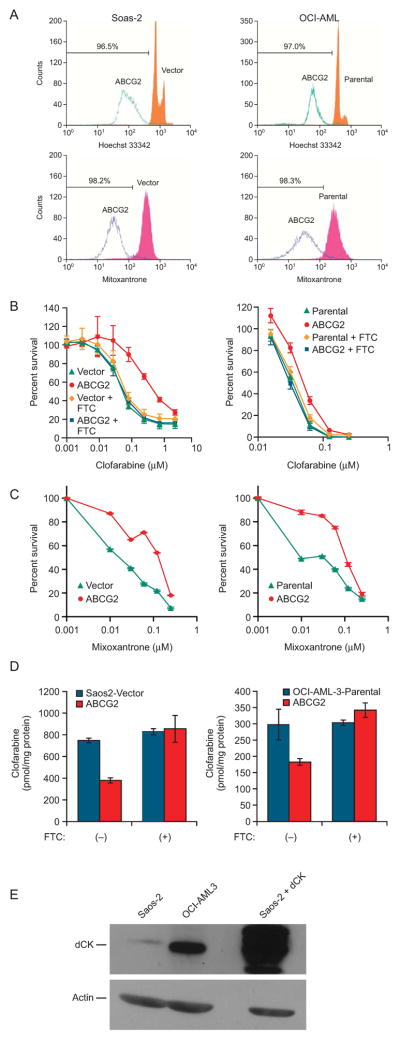
Figure 2. The cell context differentially affects ABCG2-mediated clofarabine resistance.
A, Efflux of the fluorescent ABCG2 substrates Hoechst 33342 and mitoxantrone is almost identical in Saos2 and OCI-AML3 cells. This is a representative experiment repeated several times with almost identical results. B, Clofarabine cytotoxicity was determined in Saos2 cells (left panel) and OCI-AML3 cells (right panel) in the absence and presence of fumitremorgin C (FTC) and is the average of 3 independent experiments conducted using triplicate determinations at each concentration. C, Saos2 and OCI-AML3 cells were exposed to mitoxatrone and cytotoxicity determined as described in the “Materials and Methods” the values are the average of a triplicate determination from a representative experiment repeated twice with similar results. The error bars are smaller than the symbol size. D, Intracellular accumulation of [3H]-clofarabine in Saos2 cells and OCI-AML3 cells. The values are the mean from four independent experiments with each point in duplicate. The bars represent one standard deviation. E, A representative dCK immunoblot of 100 μg of cytosol performed as described in the “Materials and Methods”. In panels A-D, the left hand column represents experiments conducted in Saos2 and the right hand column, OCI-AML3.

