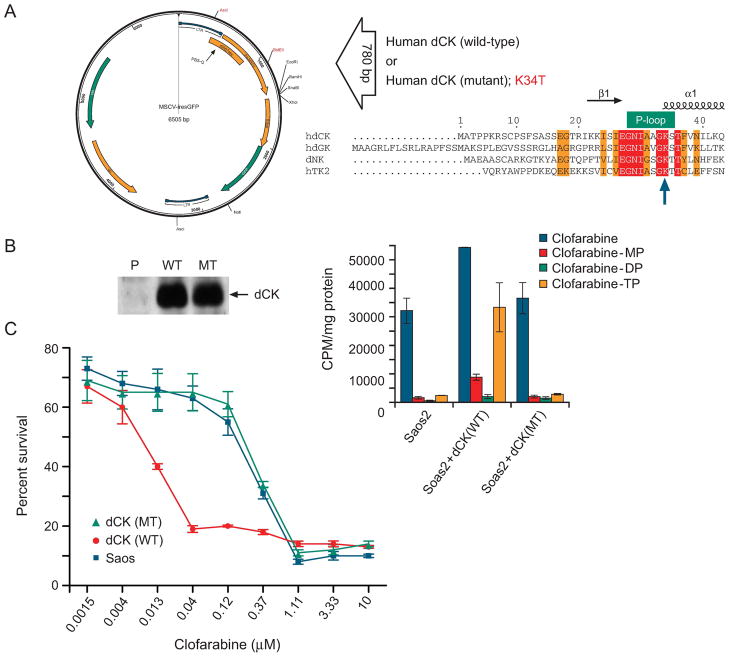
Figure 3. dCK function affects intracellular clofarabine metabolism.
A, Diagram of dCK expression vector and P-loop mutation. B, Immunoblot analysis of Saos2 cells expressing either no dCK, wild-type dCK, or mutant dCK (left panel), the ratio of phosphorylated clofarabine metabolites to unchanged clofarabine is substantially greater in parental Saos2 cells expressing wild-type dCK than in cells containing the mutant dCK (right panel). MP, monophosphate; DP, diphosphate; TP, triphosphate. C, Saos2 cells overexpressing wild-type dCK are more sensitive to clofarabine while cells harboring either mutant dCK or empty vector are of similar sensitivity. Cytotoxicity was assessed as described in the “Materials and Methods”. Each value is an average of three-independent determinations from a representative experiment repeated three times with similar results.

